Core Web Vitals are a set of three specific metrics Google uses to measure the “health” of your user experience. They are a confirmed ranking factor.
- LCP (Largest Contentful Paint): Loading Speed (How fast does the main content appear?).
- INP (Interaction to Next Paint): Responsiveness (How fast does the site react when clicked?). Note: This replaced FID in March 2024.
- CLS (Cumulative Layout Shift): Visual Stability (Does the page jump around unexpectedly?).
To fix these, you must first understand the difference between Field Data (Real Users) and Lab Data (Simulation).
1. The Primary Tool: Google PageSpeed Insights (PSI)
This is the only tool that gives you both Field and Lab data in one view.
- The Action: Go to PageSpeed Insights and enter your URL.
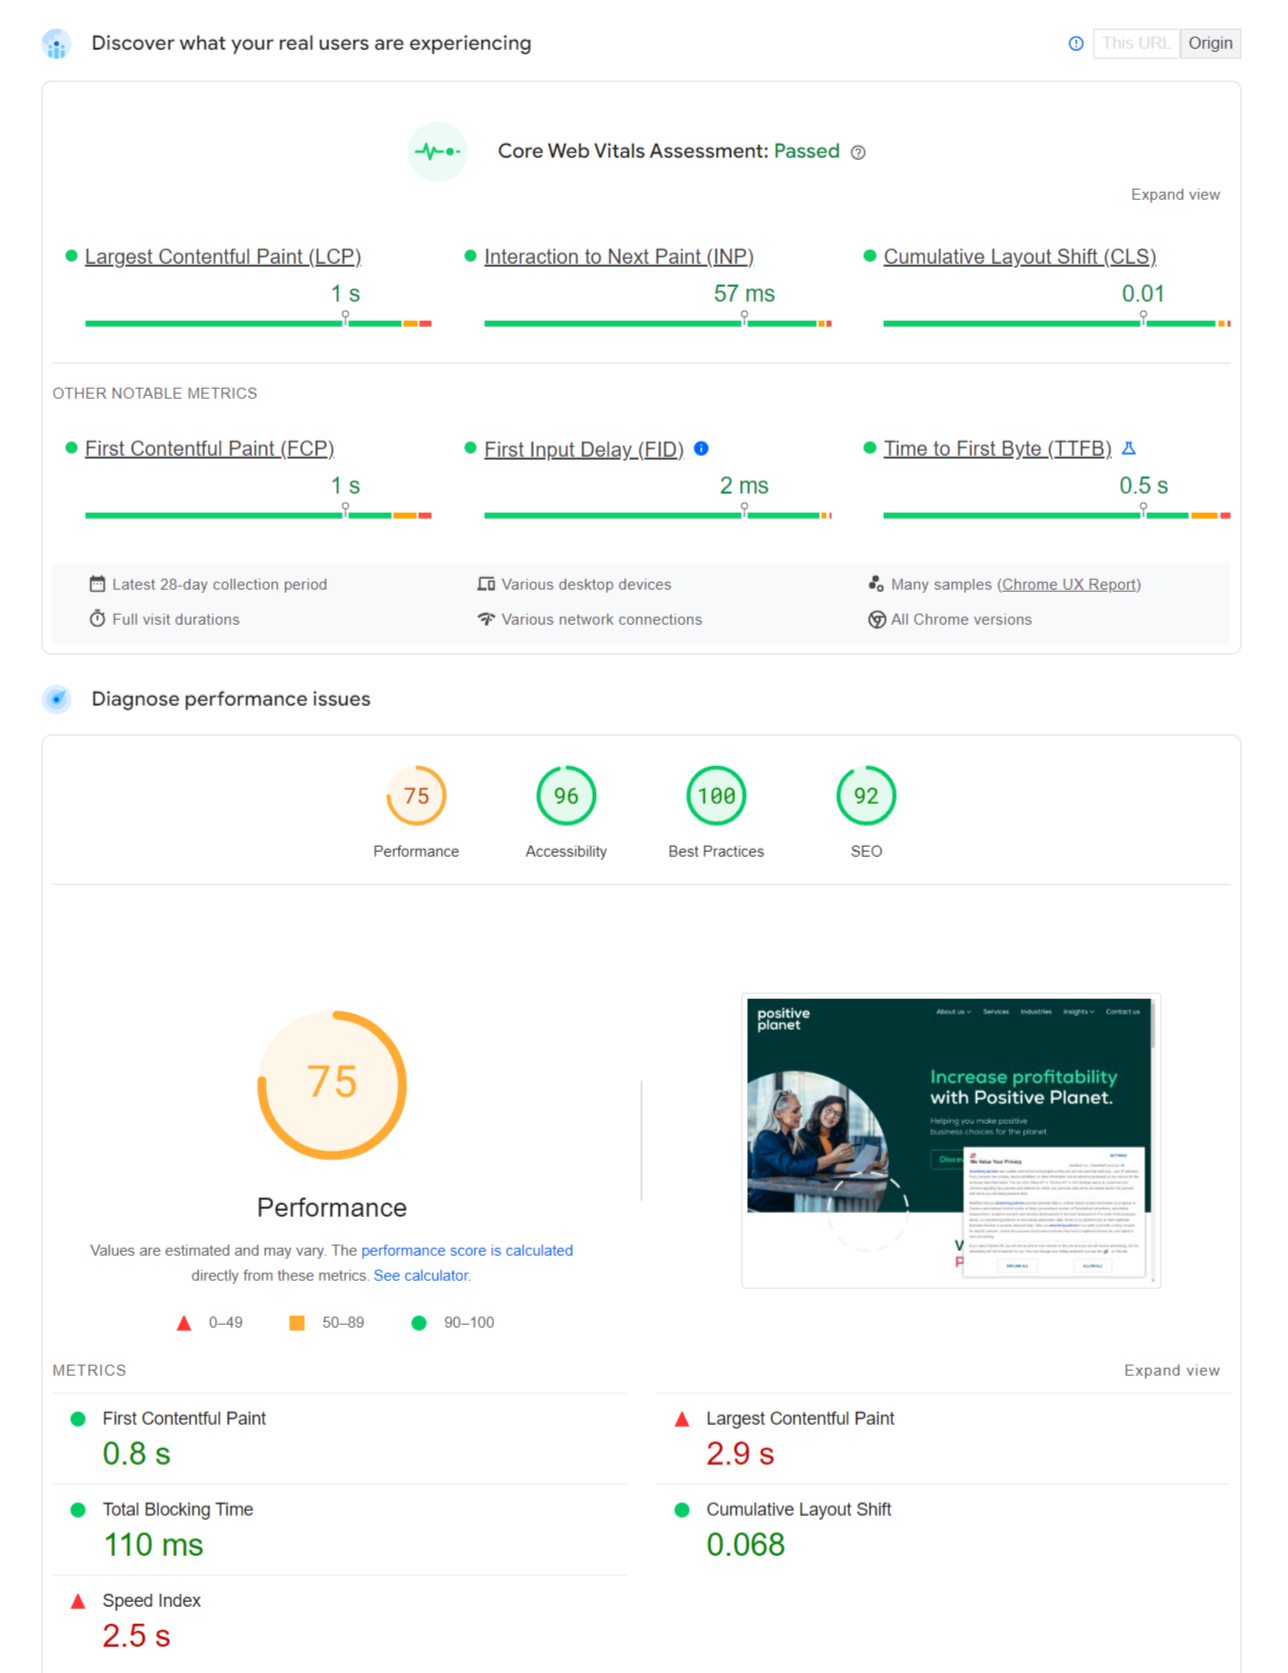
- The “Top” Section (Field Data): Look at the section labelled “Discover what your real users are experiencing”.
- What it is: This is data collected from actual Chrome users visiting your site over the last 28 days (from the Chrome User Experience Report, or CrUX).
- The Verdict: This is the only data that impacts your Google Ranking. If this section says “Failed”, you have a ranking problem, even if the bottom section looks green.
- The “Bottom” Section (Lab Data): Look at “Diagnose performance issues”.
- What it is: This is a simulation run right now on a standard device (usually a mid-range Moto G4 phone).
- The Use: Use this to debug specific code issues.
2. Site-Wide Check: Google Search Console
PSI checks one page at a time. To see your whole website at once, use Search Console.
- Navigate: Go to Experience > Core Web Vitals.
- Google groups similar pages together. If 50 blog posts all have the same slow template, it will list them as one “Group” of 50 URLs with a “Poor” LCP status.
- This helps you prioritise. Fix the template that affects 500 pages before fixing the one that affects 5.
3. Real-Time Check: The Web Vitals Extension
If you are a developer making changes to code, you need to see the impact instantly.
- The Tool: Install the Web Vitals Chrome Extension (by Google).
- Load your page. The extension badge in your browser bar will turn Green, Orange, or Red instantly.
- Click it to see the live LCP, CLS, and INP scores for your specific session. This is useful for catching layout shifts (CLS) that happen as you scroll down the page.
4. Debugging Layout Shifts (CLS)
CLS is often the hardest to “see” because it happens so quickly.
- Open Chrome DevTools (F12), go to the “Rendering” tab (click the three dots > More Tools > Rendering), and tick “Layout Shift Regions”.
- As you browse the page, any element that moves unexpectedly will flash Blue. This highlights exactly which image or ad is pushing your content down and causing the failure.
“Field Data” is the Truth
The most common confusion is: “My PageSpeed score is 95/100, but Search Console says I am failing. Why?”
“Field data is a historical report… It represents the ground truth of what your users are actually experiencing. Lab data is a simulation… it is a proxy for performance, but it may not always match reality.”
You cannot “optimise” your way out of a penalty using just a simulation. If real users on slow 4G phones are having a bad experience (Field Data), Google will penalise you, even if your developer’s high-speed WiFi connection (Lab Data) shows a perfect score.

 Salesforce