Identifying your top-performing pages allows you to understand what content resonates most with your audience, where your link equity is strongest, and which pages are driving the most conversions. In Google Analytics 4 (GA4), this data is easily accessible and should be reviewed regularly.
Step 1: Navigating to the Core Report in GA4
The primary report for measuring page traffic and engagement is the Pages and Screens report.
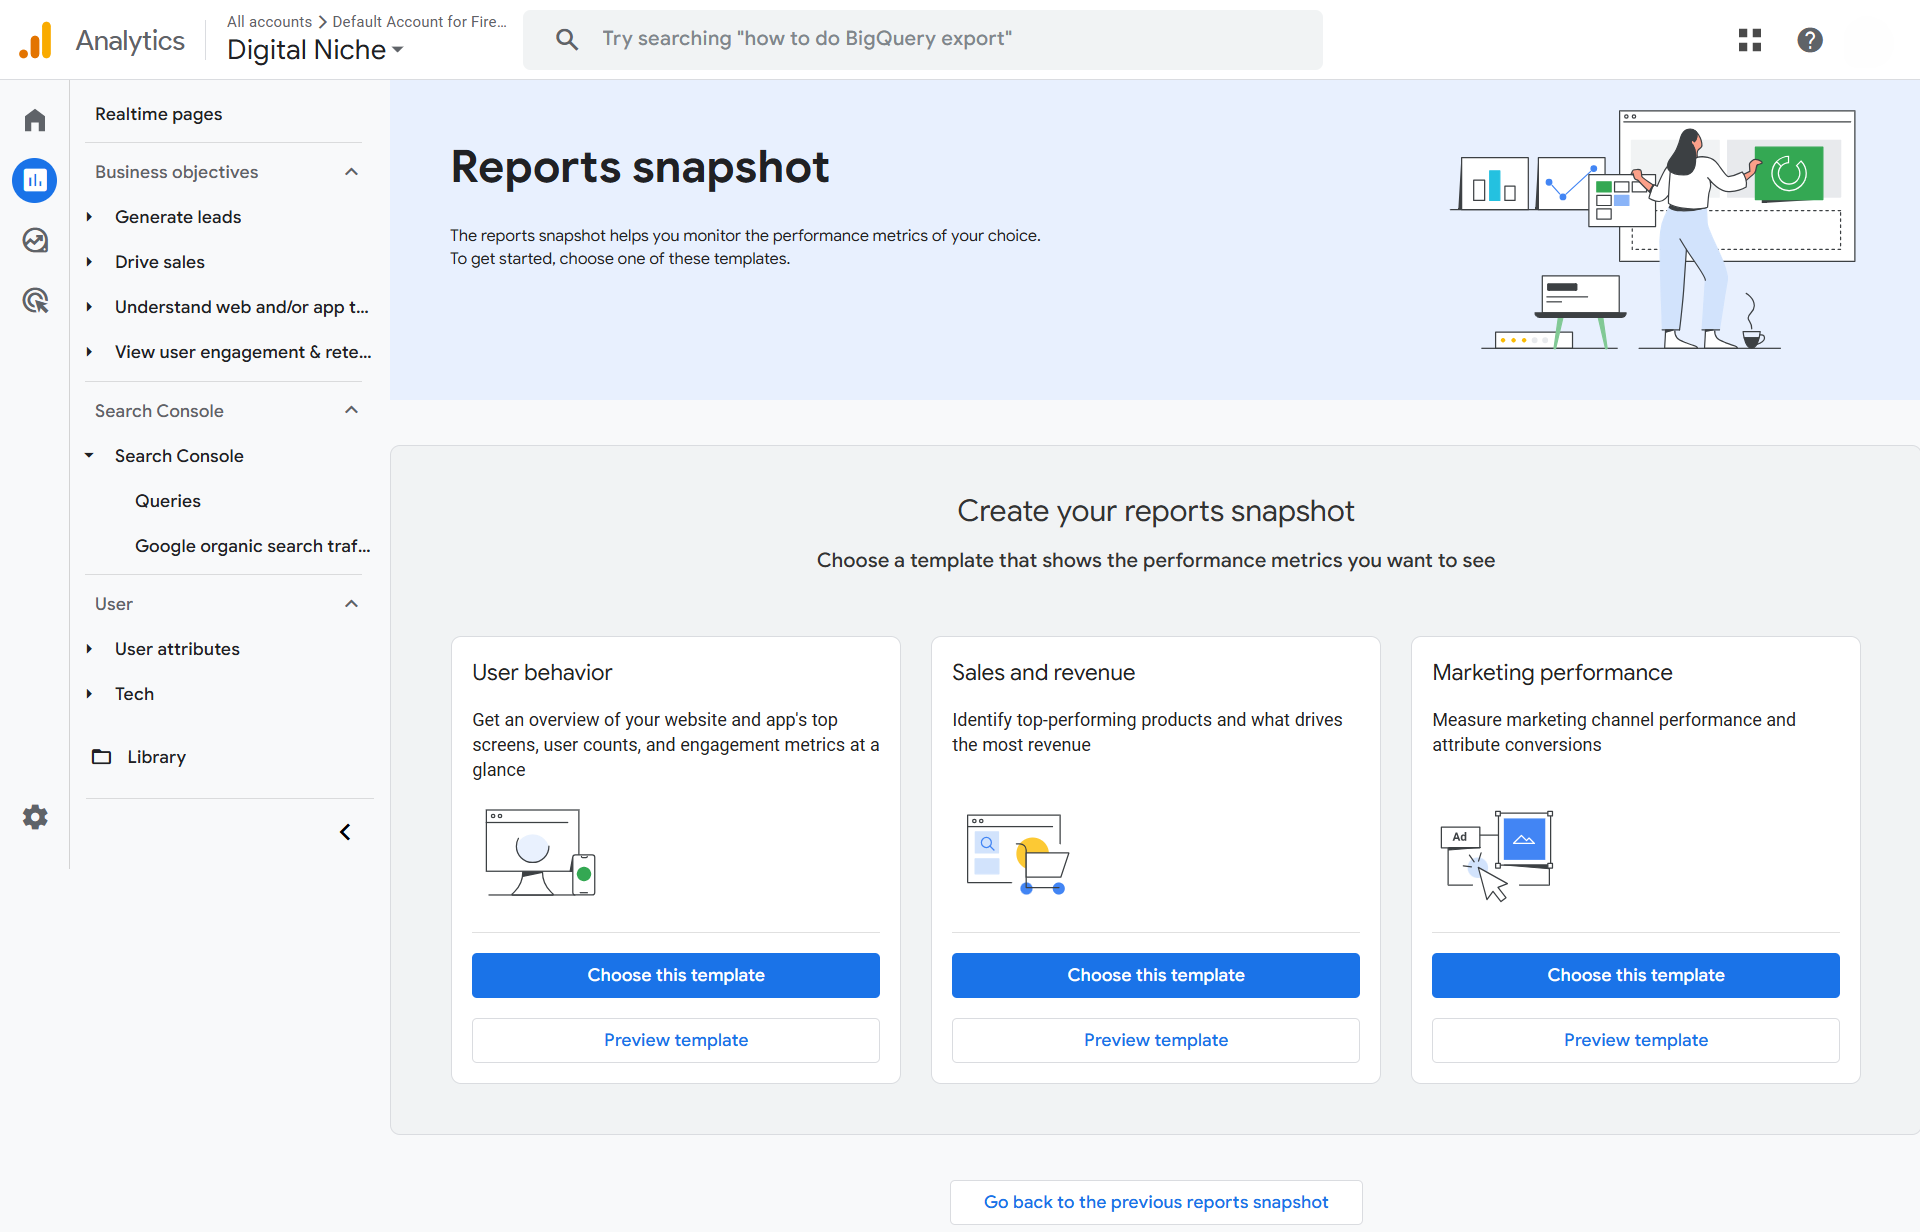
- Access Reports: Log into your GA4 account and navigate to the Reports section.
- Engagement: Open the Engagement collection.
- Pages and Screens: Click on the “Pages and screens” report.
Step 2: Interpreting the Key Traffic Metrics
The standard Pages and Screens report will automatically display the following key metrics, sorted by the page title or path.
GA4 Metric | Definition | Why It Matters for Optimal Strategy |
Views | The total number of times a page was viewed by all users. | The best measure of raw traffic and overall content popularity. Sort by this metric to find your highest-traffic pages. |
Users | The number of unique users who viewed that specific page. | Shows the true reach of the content among your audience. |
Event count | The total number of events (like clicks, scrolls, file downloads) triggered on that page. | Helps understand the level of user engagement and activity. |
Engagement rate | The percentage of engaged sessions (sessions lasting longer than 10 seconds, having 2+ screen/page views, or having 1+ conversion event). | A crucial quality metric. High engagement confirms the content is relevant and fulfilling user intent. |
Conversions | The number of times a conversion event (e.g., lead form submission, phone call click) occurred on that page. | Directly links content performance to business goals and ROI. |
Step 3: Customizing the Report for Deeper Insights
While the default report is useful, UTDS Optimal Choice advises tailoring it for a more strategic view.
1. Changing the Primary Dimension (Page Path vs. Title)
- By default, the report often groups traffic by Page Title. While good for readability, the Page Path (/about-us/, /services/seo-consulting/) is better for analyzing traffic flowing to specific URLs.
- Click the dropdown above the table (labeled “Page title and screen name”) and select “Page path and screen class” to change the dimension.
2. Adding a Secondary Dimension (Traffic Source)
To see where the traffic is coming from, add a secondary dimension:
- Click the plus icon (+) next to the primary dimension column.
- Select Traffic Source > Session default channel grouping.
- This breaks down the traffic for each page by source (e.g., Organic Search, Direct, Paid Search, Social). This helps determine which pages are performing best specifically in Organic Search.
3. Filtering for Conversions
To prioritize pages that drive money-making actions, filter the data:
- Click the dropdown next to the Conversions metric.
- Select your most important conversion event (e.g., generate_lead or form_submit).
- The table will instantly update to show which pages contributed to that specific business outcome, allowing you to prioritize optimization efforts on those pages.

 Salesforce