Step 1: Connect Your Data Sources
Looker Studio is empty until you plug in your data. For SEO, you need two primary “Connectors”: Google Search Console (for rankings) and Google Analytics 4 (for traffic/conversions).
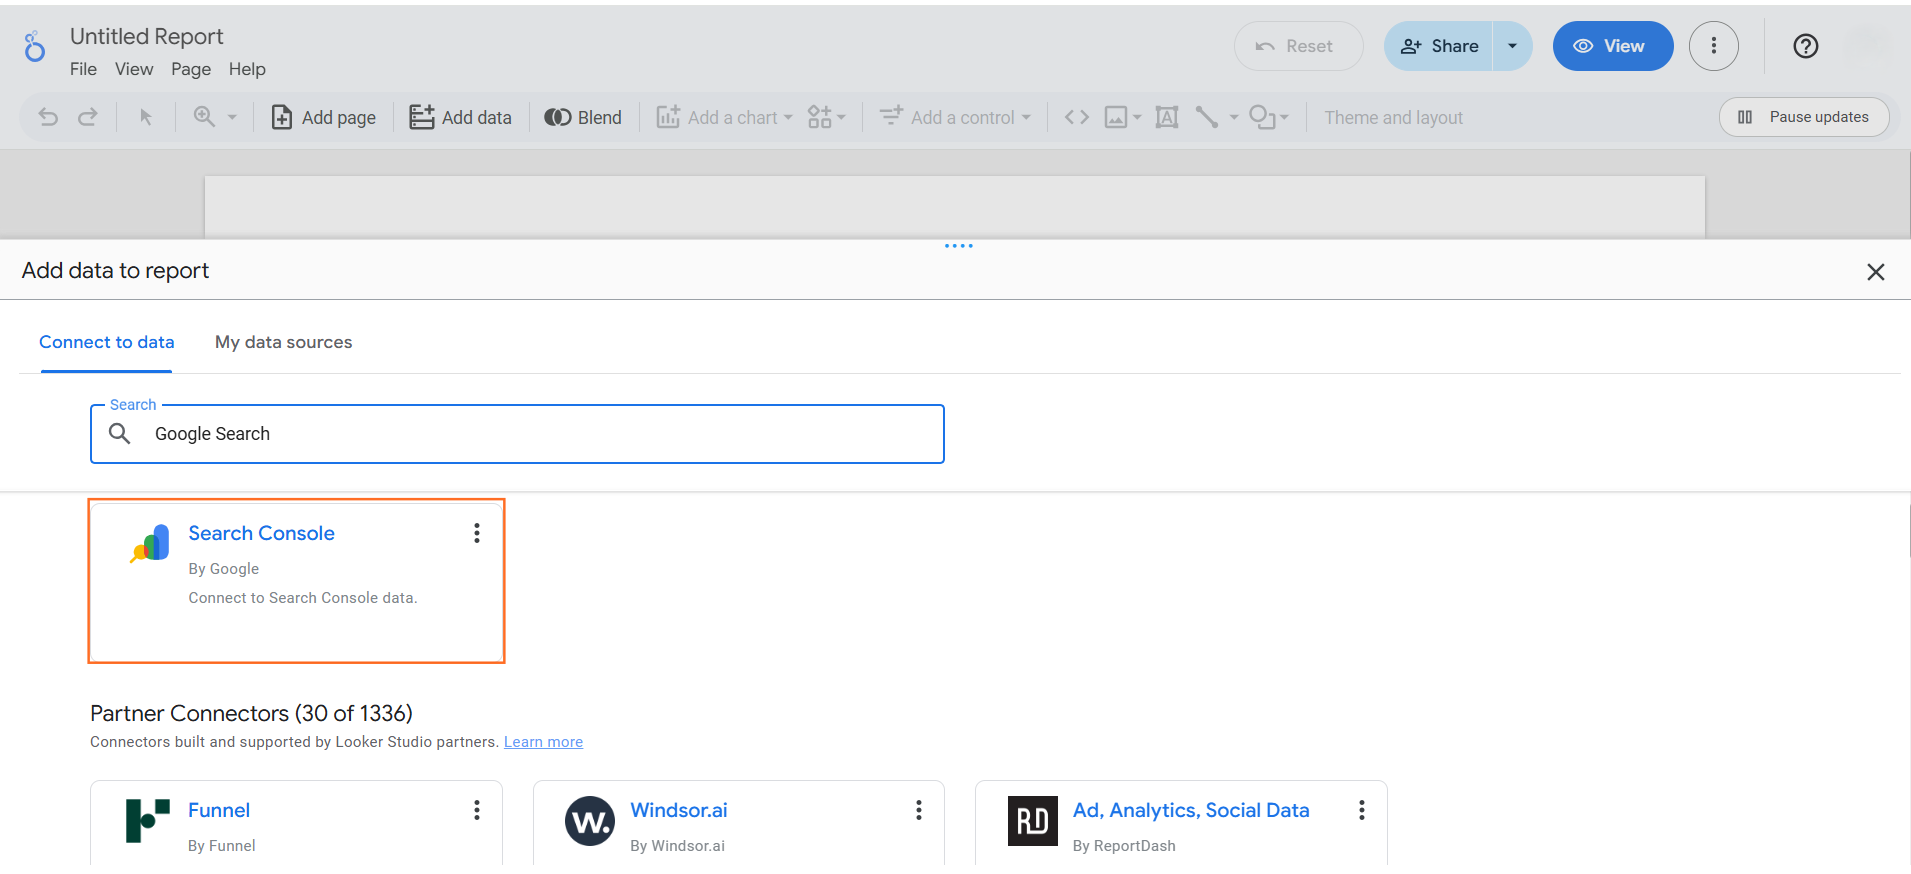
- Create: Go to lookerstudio.google.com and click Blank Report.
- Add Data:
- Select Google Search Console.
- Choose your domain (ensure you pick Site Impression > Web).
- Click Add.
- Blend: To add GA4, click Add Data in the toolbar, select Google Analytics, choose your property, and add it to the same report.
Step 2: The “Executive Summary” (Scorecards)
The top of your report should answer the question: “Are we winning or losing?” instantly. Use Scorecards for this.
- Insert: Click Add a chart > Scorecard.

- Configure: Drag Clicks (from GSC) to the Metric field.
- Compare: In the setup panel, scroll down to Comparison date range and select Previous period.
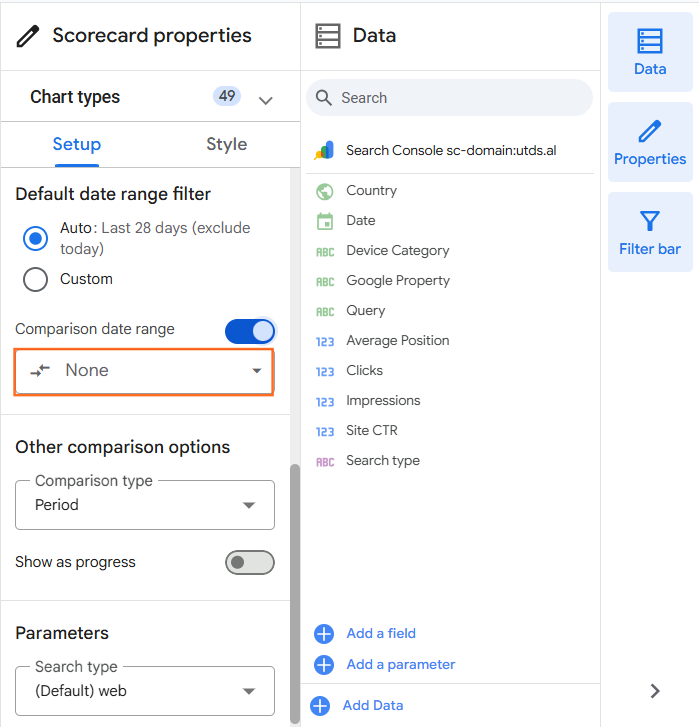
- Result: This shows “Total Clicks: 5,000” with a small green arrow saying “5% up vs last month.”
- Repeat: Create scorecards for Impressions (Visibility), CTR (Relevance), and GA4 Sessions (Traffic).
Step 3: The “Traffic Trend” (Time Series)
Clients need to visualize growth over time. A Time Series Chart shows the trajectory of your SEO efforts.
- Insert: Click Add a chart > Time series.
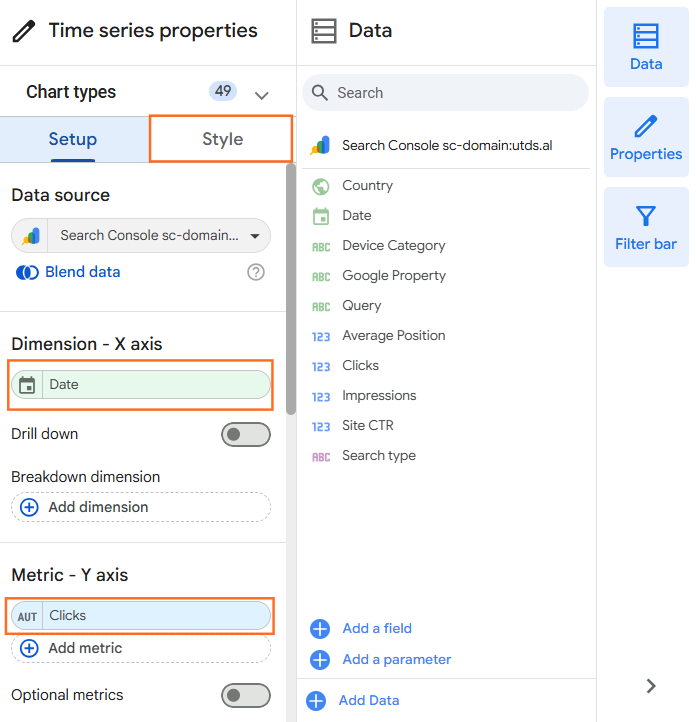
- Dimension: Set to Date.
- Metric: Set to Clicks (and optionally add Impressions as a second line).
- Style: Go to the Style tab and set “Trendline” to Linear to smooth out daily spikes and show the true direction of growth.
Step 4: The “Keyword Performance” (Table)
This is the most actionable part of the report. It shows exactly which queries are driving traffic and where you rank.
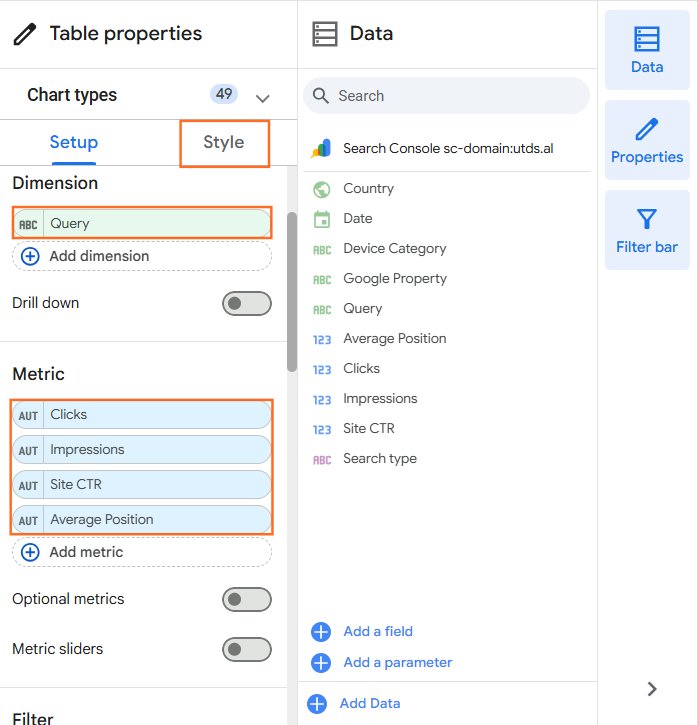
- Insert: Click Add a chart > Table.
- Dimension: Set to Query (from GSC).
- Metrics: Add Clicks, Impressions, CTR, and Average Position.
- Heatmap: In the Style tab, change the “Clicks” column to Heatmap. This highlights your top-performing keywords in dark blue, making the table easy to scan.
- Filter: Add a filter to exclude “Brand Name” queries if you want to see pure non-branded SEO performance.
Step 5: Automation (The Schedule)
The goal of Looker Studio is to stop manual reporting. Set it to email you (or your client) automatically.
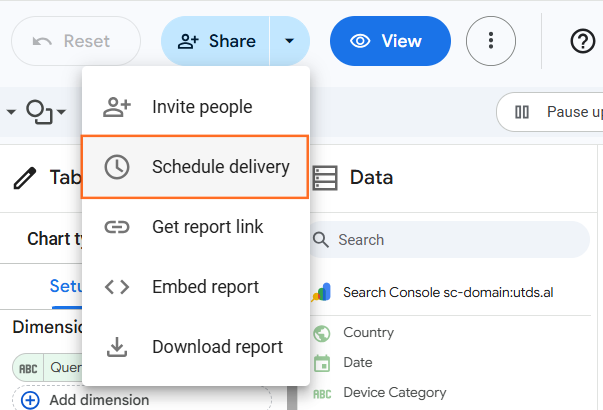
- Share: Click the small arrow next to the Share button in the top right.
- Schedule: Select Schedule delivery.
- Settings:
- Recipients: Enter your email (and client email).
- Start time: Monday at 08:00 AM.
- Repeat: Weekly or Monthly.
- Format: Looker Studio will send a high-quality PDF of the dashboard directly to their inbox.

 Salesforce