Creating a new report in Salesforce is the primary way to gain business intelligence, track performance against KPIs, and visualise data related to your sales, service, or custom processes. The process relies on selecting the correct Report Type, which dictates the data fields you can access.
Step 1: Initiate Report Creation
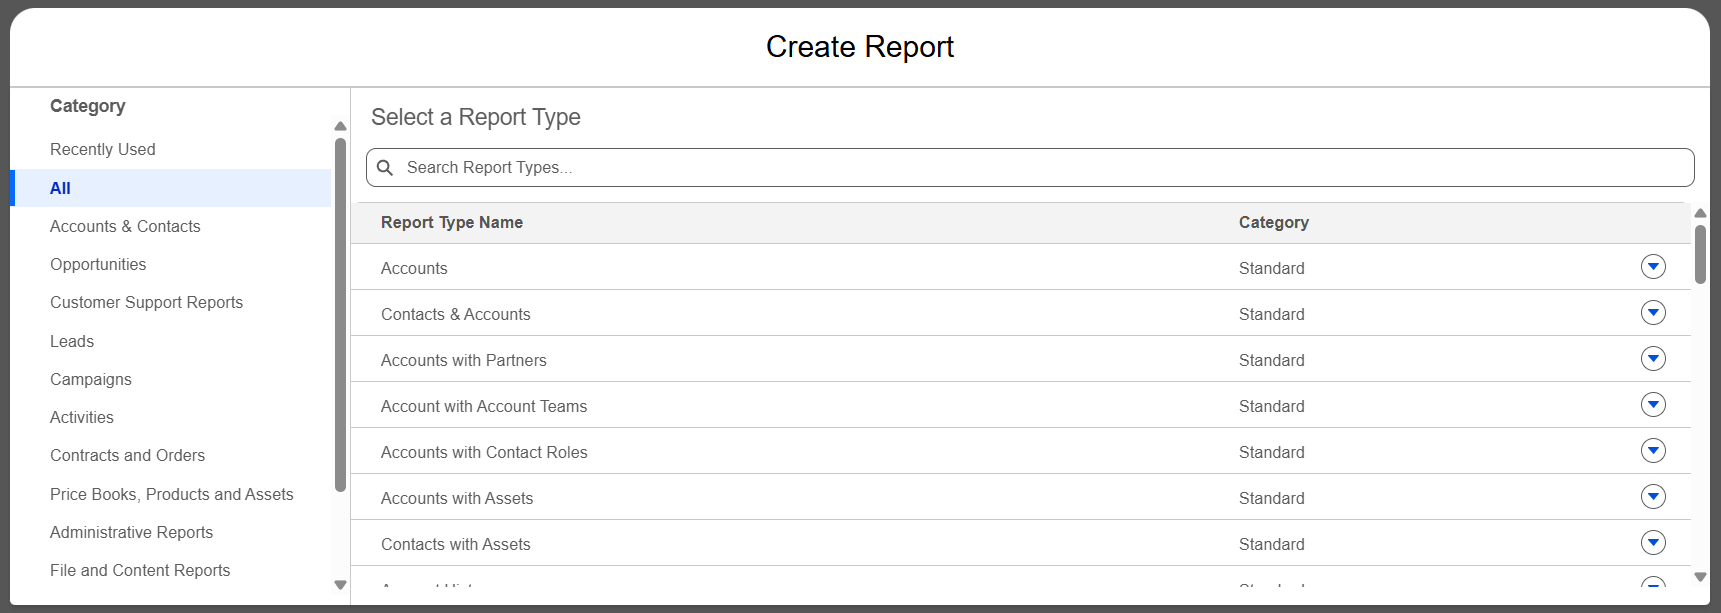
- Navigate to Reports: Go to the App Launcher tp Reports
- Create New: Click the “New Report” button (usually in the upper right corner).
- Choose Report Type (The Crucial Step): A window will pop up asking you to select a Report Type.
- The Report Type defines the objects whose records will be included in the report (e.g., Leads, Accounts, or a combination like Accounts with Opportunities).
- Search and select the type that contains the primary object you want to analyse (e.g., Leads for tracking lead source, or Opportunities for tracking pipeline value). Click “Start Report.”
Step 2: Define and Filter Data
The Report Builder screen opens, allowing you to define the data set you want to see.
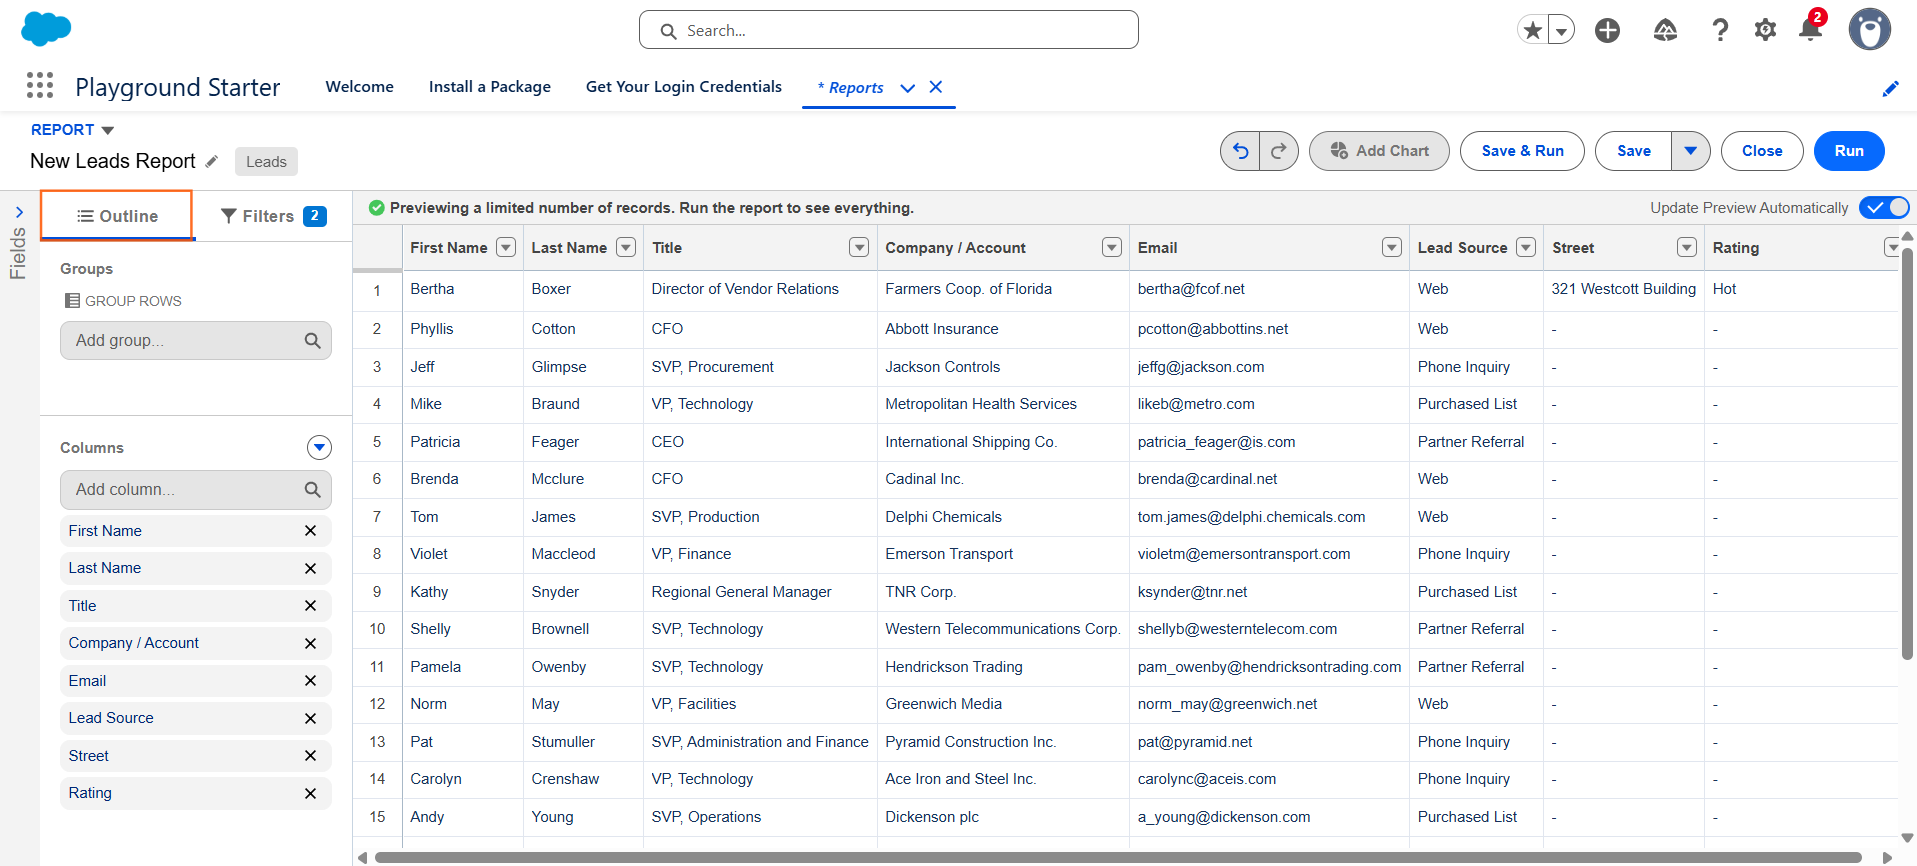
- Outline Panel: Use the Outline panel (left side) to add, remove, and arrange columns (fields) in your report. Drag fields from the left onto the report preview table in the center.
- Filters Panel: Use the Filters panel (left side) to narrow down the report results.
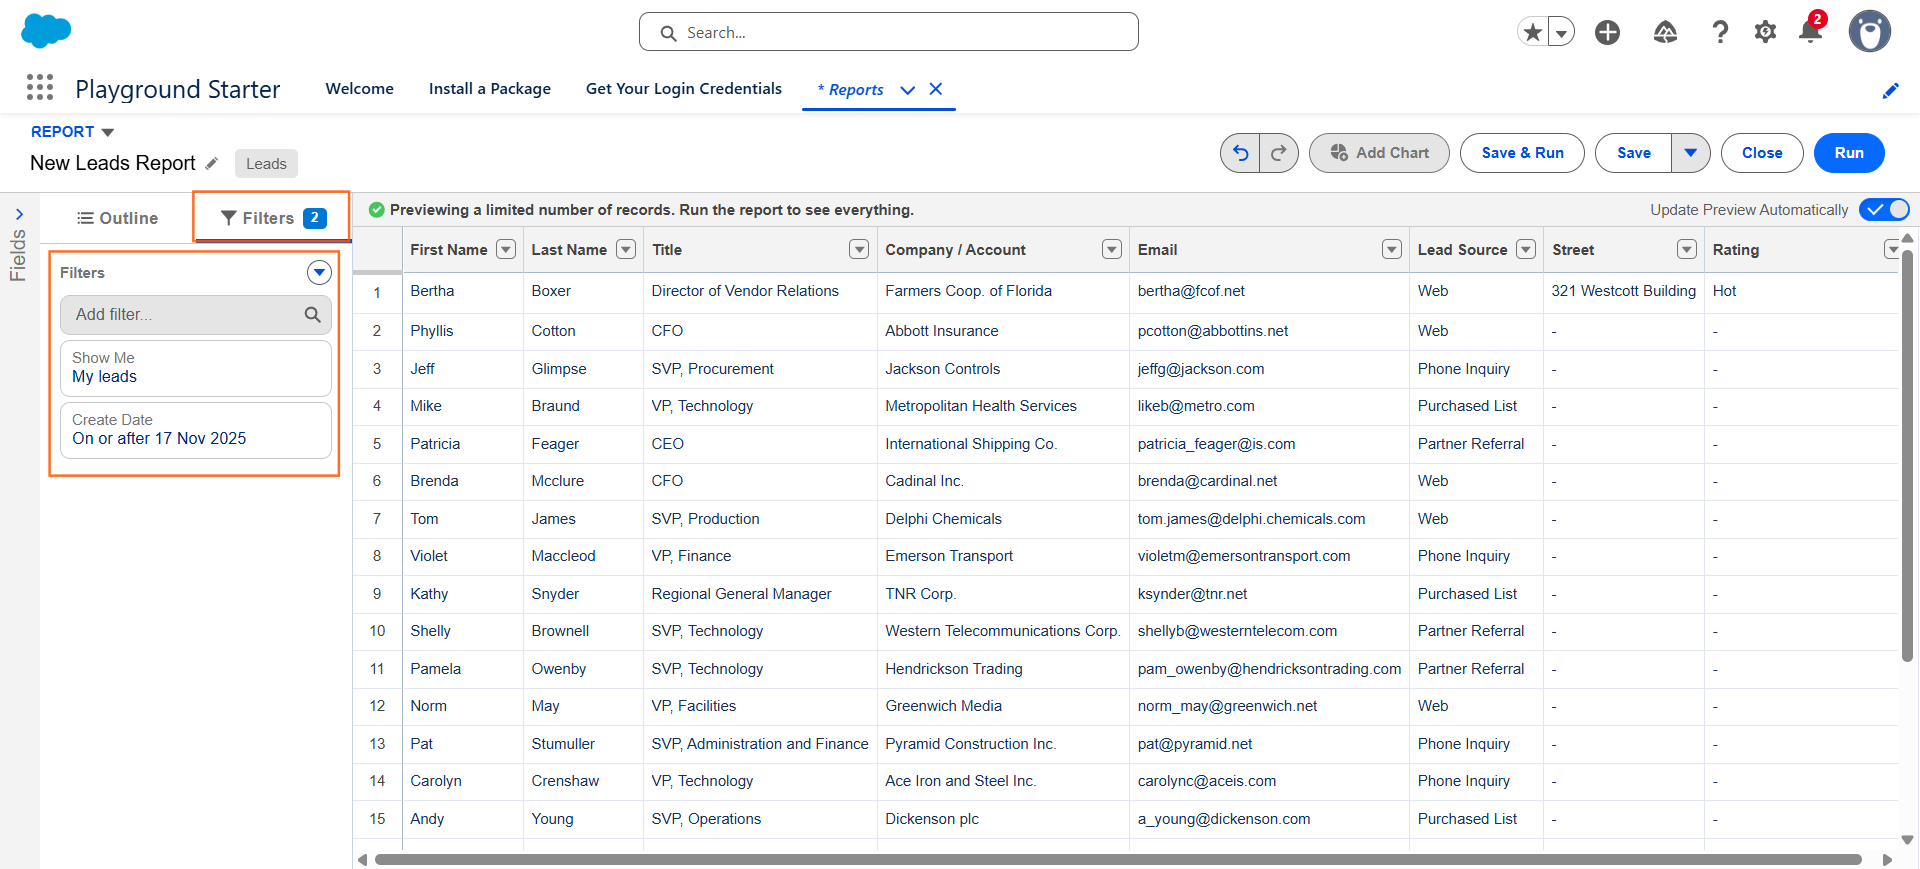
- Show Me: Select the scope (e.g., “My Leads” vs. “All Leads”).
- Date Field: Choose the date range (e.g., “Created Date”) and the timeframe (e.g., “Last 30 Days” or a custom range).
- Add Filters: Add criteria for specific fields (e.g., Lead Source equals Organic Search, or Industry equals Technology).
Step 3: Group and Summarise Data
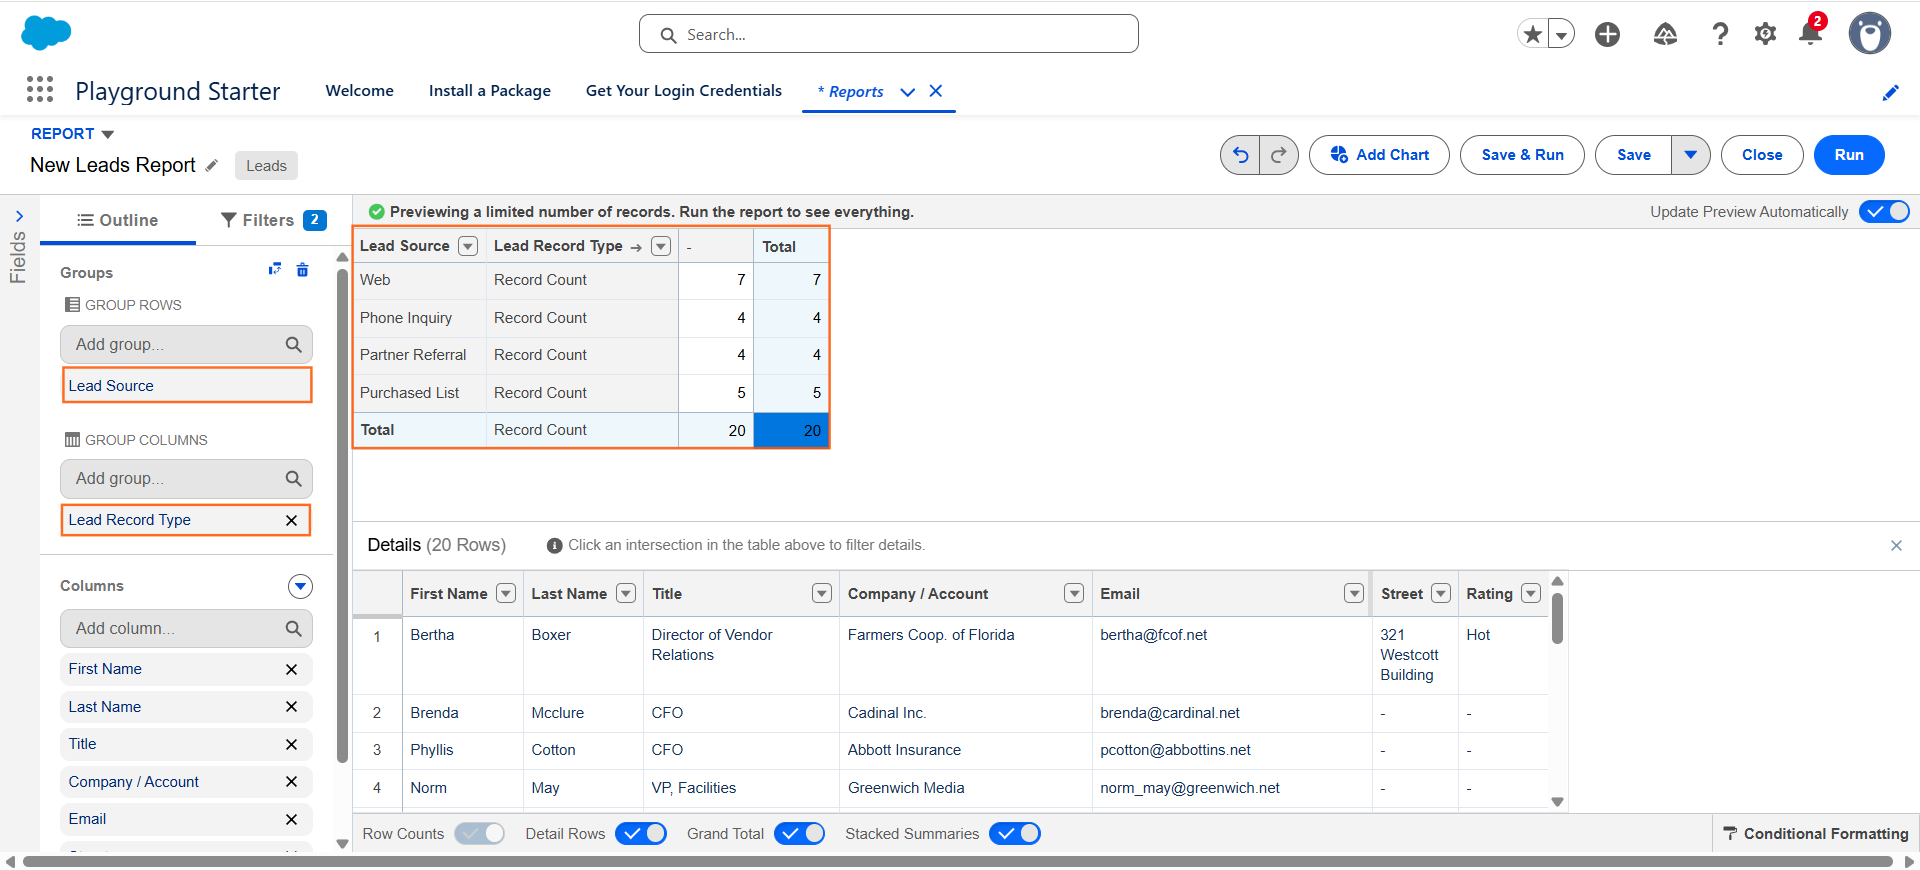
To make the report useful for analysis, you must organise the data by adding groups and summaries.
- Group Rows: In the Outline panel, click “Add Group” under the “Group Rows” section.
- Group by the field you want to analyse (e.g., Lead Source to see all leads generated by each source).
- Summarise Data: In the report preview table, hover over a numeric field (e.g., Amount for Opportunities or Record Count). Click the down arrow next to the column name and select “Summarise.”
- Choose Sum, Average, or Count.
- Group Columns (Optional): You can also add groups across the columns to create matrix-style reports (optimal for cross-tabulating data, like showing Lead Source grouped by Status).
Step 4: Run, Save, and Share
- Run Report: Click the “Run” button to view the report with the finalised data.
- Save Report: Click “Save” and give the report a descriptive name (e.g., “Q4 Lead Source Conversion Rates”).
- Folder Location: Choose a Report Folder where the report will be stored. Access to the report is controlled by the permissions on this folder.
- Subscribe/Export: From the run report view, you can Subscribe (schedule the report to be emailed regularly) or Export the data to a CSV file for external analysis.

 Salesforce