A Joined Report in Salesforce is a powerful report format that allows you to combine data from up to five different Report Types into a single view. This is essential for creating unified executive scorecards or analyzing relationships between objects that aren’t directly linked (e.g., comparing Accounts with no open Opportunities against Accounts with open Cases).
Step 1: Initiate and Convert the Report Format
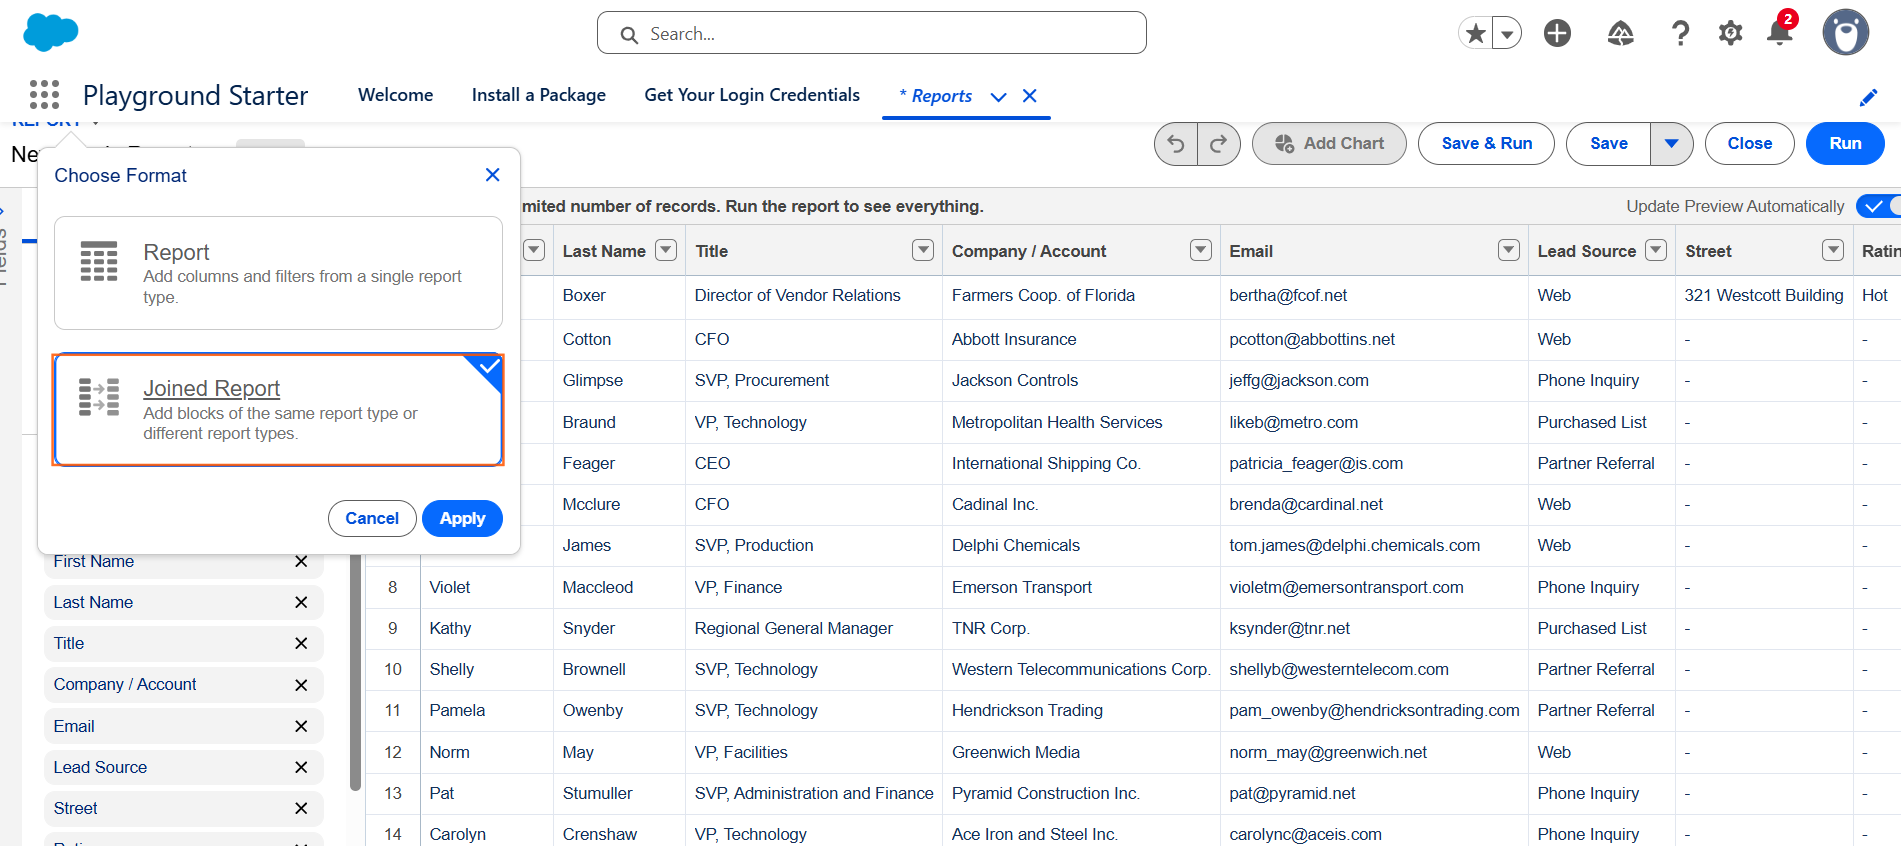
You must start a standard report and then convert its format to “Joined.”
- Navigate to Reports: Click App Launcher, Search for Reports tab.
- Create New: Click the “New Report” button.
- Choose the Principal Report Type: Select the report type that will serve as the foundation for the entire joined report (e.g., Accounts). This first block determines how common fields are named and related. Click “Start Report.”
- Convert to Joined Format: In the Report Builder, look for the format dropdown menu (often near the top-left, usually displaying “Summary” or “Tabular”). Select “Joined” and click “Apply.”
Step 2: Add and Configure Blocks
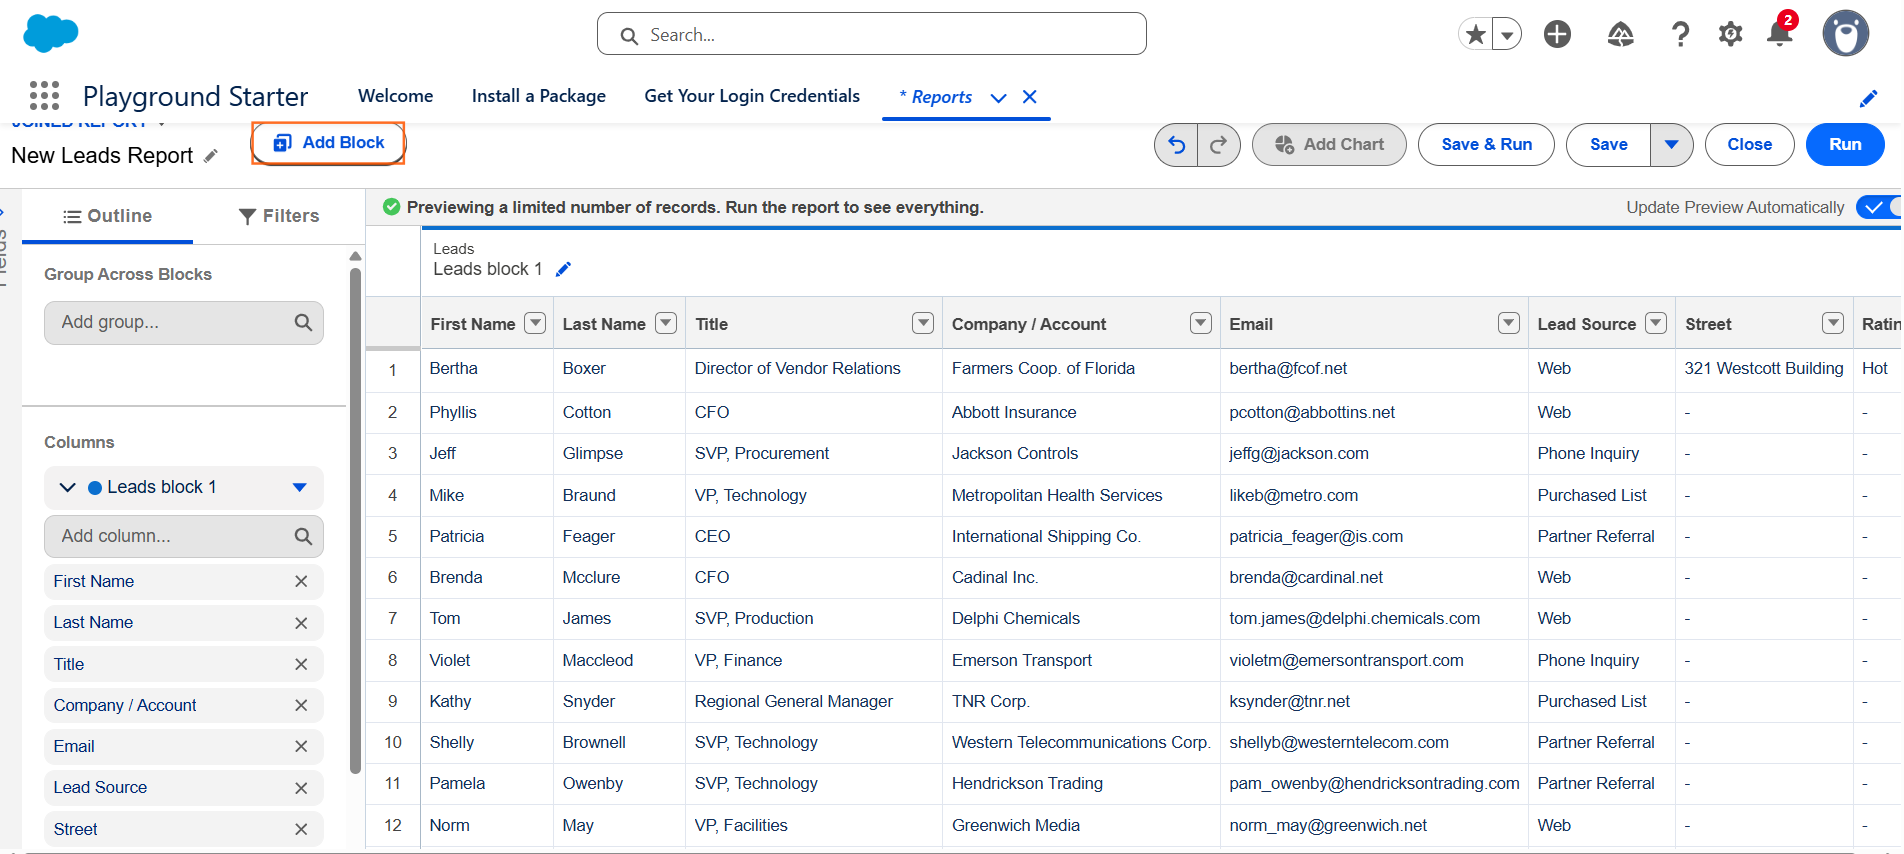
A Joined Report is structured by Blocks, with each block representing a separate data set (report type).
- Add Block: Click the “+ Add Block” button (now visible along the top of the report preview).
- Select Report Type: Choose the second report type you need to compare (e.g., Cases). Salesforce will confirm which common objects are shared for the join (in this example, both Accounts and Cases are related to the Account object).
- Repeat: Repeat this process to add up to five different blocks.
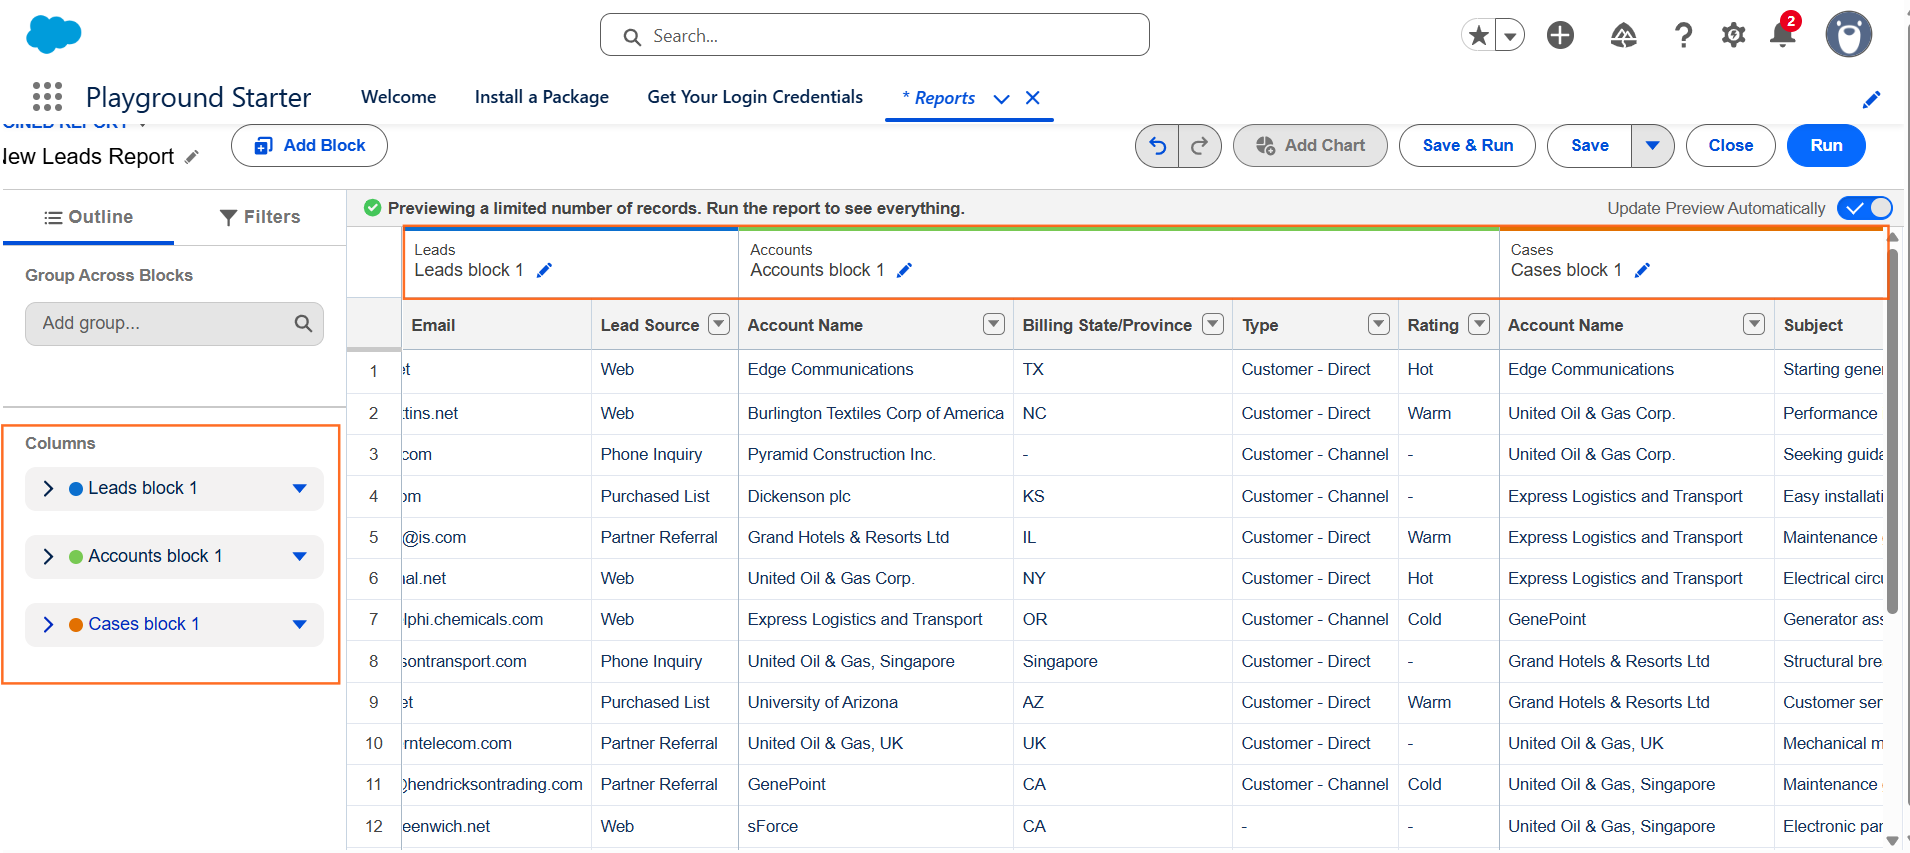
Filter Each Block: In the Filters panel on the left, you will now see separate filter sections for Block 1, Block 2, etc. Crucially, filter each block individually to show only the data relevant to that block (e.g., in the Cases block, filter to show only Case Status equals Open).
Step 3: Group Across Blocks (The Core Analysis)
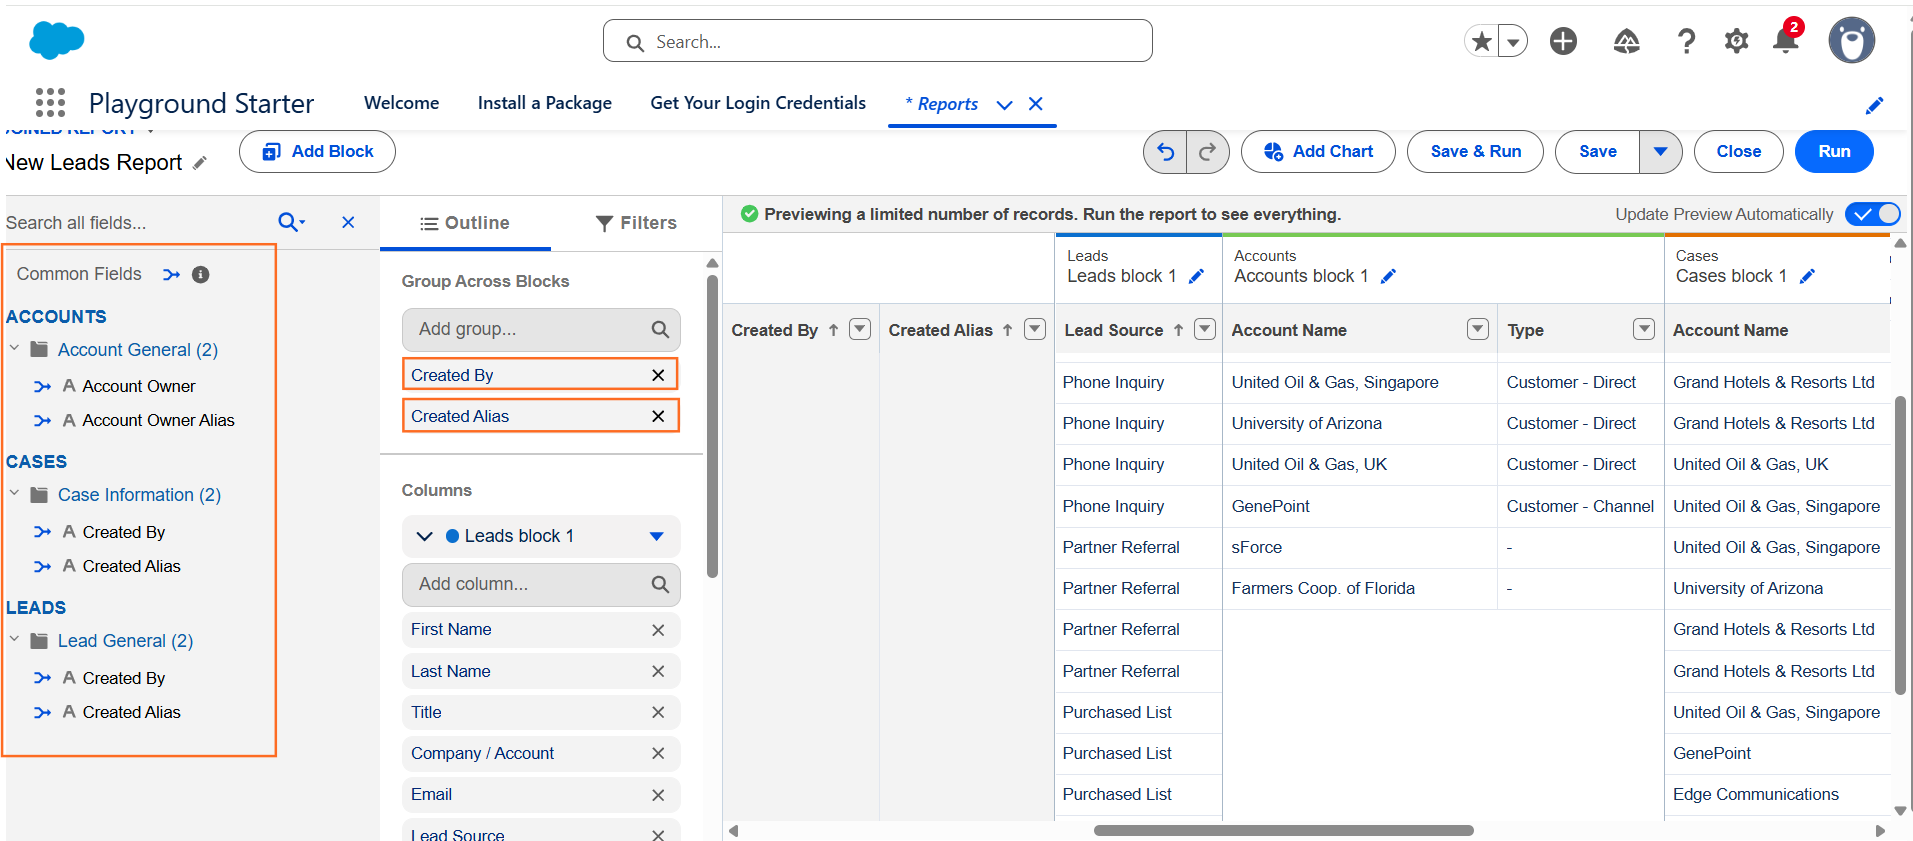
To make the data meaningful, you must group the different blocks by a common field.
- Common Grouping: In the Outline panel, click “Add Group” under the “Group Rows” section.
- Select Common Field: Select a field that exists in all or most of your blocks (e.g., Account Name or Account Owner).
- Result: This grouping aligns all the records from all blocks (Opportunities, Cases, Accounts) so they can be viewed side-by-side for the same parent record (e.g., viewing all open cases and all closed opportunities for a single Account).
- Summarize Data: Summarize key numerical fields within each block (e.g., Sum of Amount in the Opportunity block, Count of Records in the Case block) to provide quick insights.
Step 4: Finalize and Visualize
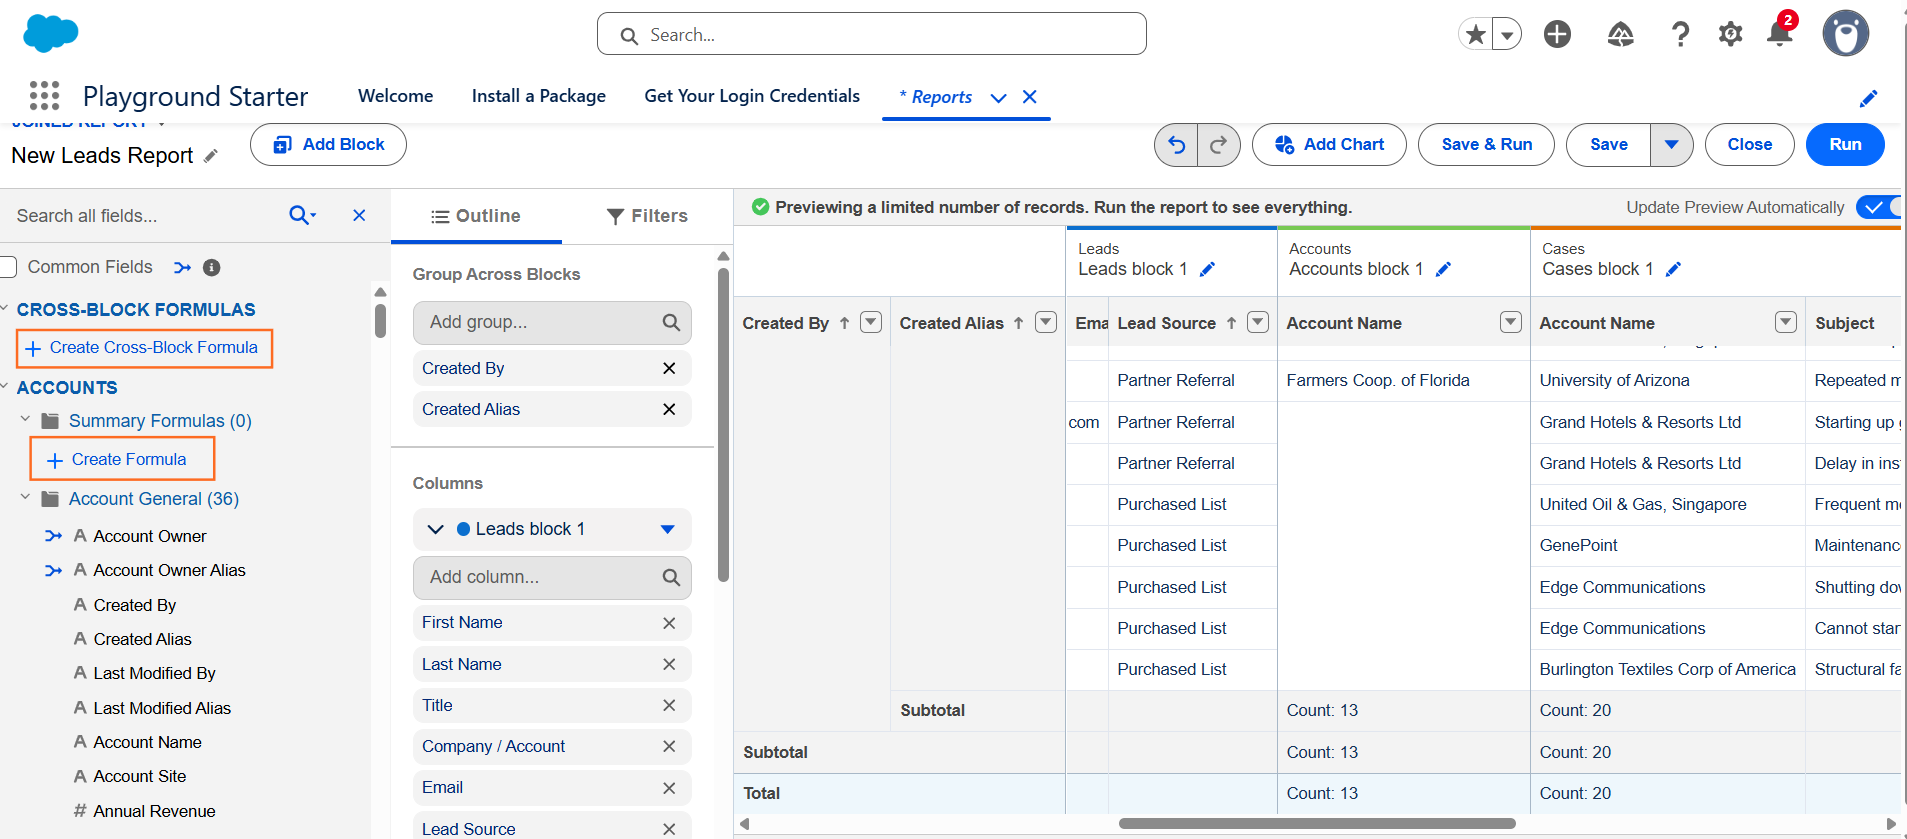
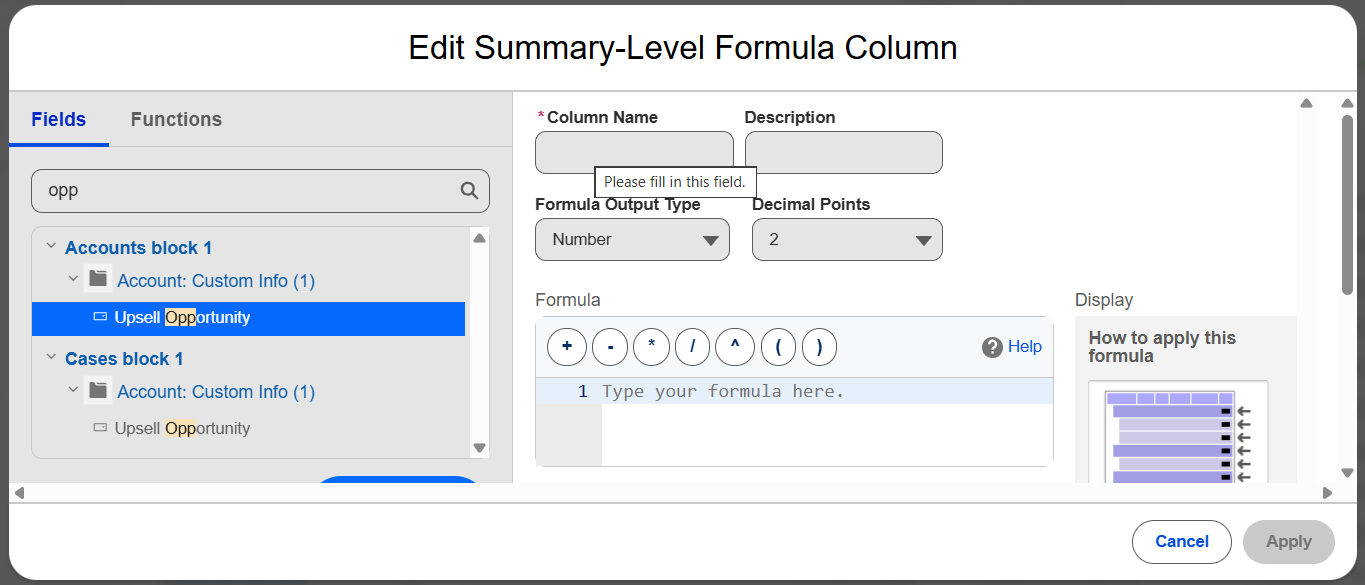
- Cross-Block Formulas (Advanced): You can add custom summary formulas that perform calculations between the blocks (e.g., Opportunities / Cases to find the close rate per support issue).
- Run and Save: Click “Run” to view the report and ensure all the blocks are aligned correctly.
- Save: Click “Save” and choose an appropriate report folder.
UTDS Optimal Use Case: Use a Joined Report to create a Sales Rep Scorecard by using Block 1 for Opportunities (Closed Won Amount) and Block 2 for Activities (Total Calls/Emails) grouped by User Name.

 Salesforce