In Google Ads, identifying your top-performing ad copy has shifted from looking at a single “winning ad” to analyzing individual assets (headlines and descriptions). Since Responsive Search Ads and Performance Max campaigns mix and match your copy, you need to see which specific pieces are driving results.
How to Check Asset Performance
1. For Responsive Search Ads (Search Campaigns)
This shows you which headlines and descriptions Google’s AI is actually serving and how users are responding.
- Select a campaign
- Navigate to the campaign > assets menu on the left.
- The “Performance” Column: Google labels each asset as Learning, Low, Good, or Best.
- Tip: Replace any assets marked as “Low” after 30 days of data.
- Tip: Replace any assets marked as “Low” after 30 days of data.
2. For Performance Max Campaigns
PMax has a more advanced report that now includes actual conversion data for individual text assets.
- Go to Campaigns and select your PMax campaign.
- Click Asset groups in the Campaign menu.
- On the asset group card, click View details.
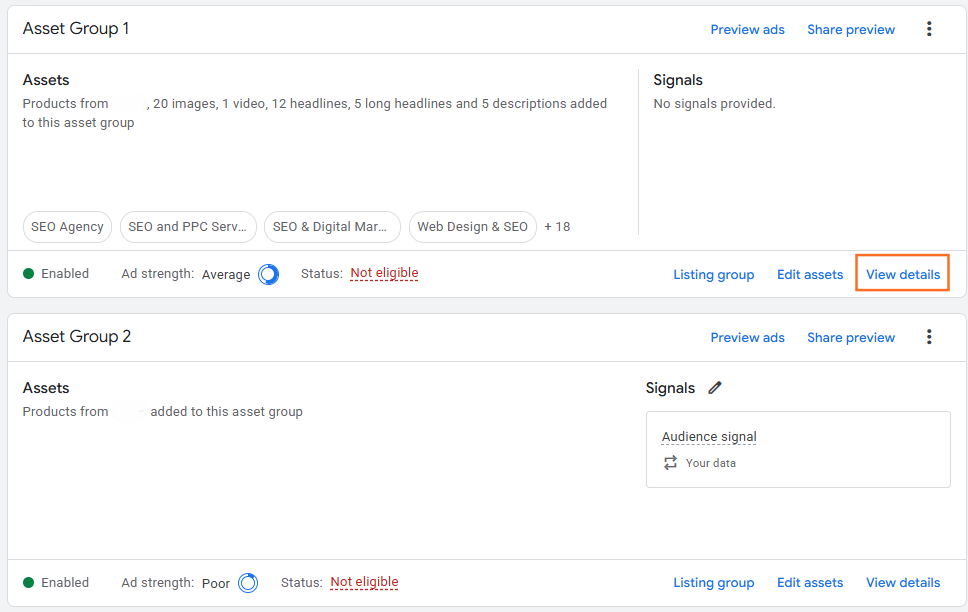
Note: Incase you don’t see it, change the view mode to summary from table
- Add Conversion Columns: By default, you’ll see the “Performance” rating (Low/Good/Best). Click the Columns icon and add Conversions and Conv.value.
- Note: Conversions are attributed to every asset shown in that specific ad. If a headline and description were shown together and led to a sale, both get “1” conversion.
- Note: Conversions are attributed to every asset shown in that specific ad. If a headline and description were shown together and led to a sale, both get “1” conversion.
Understanding the “Performance” Ratings
Instead of just looking at raw numbers, Google uses these ratings to tell you how that asset contributes to the overall ad’s success:
Rating | What it means | Action |
Best | This is your strongest asset. It appears frequently and has a high engagement/conversion rate. | Keep & Clone. Use similar phrasing in other ad groups. |
Good | It performs well but doesn’t lead the pack. | Keep. No immediate changes needed. |
Low | This asset is underperforming compared to others in the same group. | Replace. Try a different hook, offer, or tone. |
Learning | Not enough impressions yet (usually needs ~5,000 impressions per group). | Wait. Don’t make changes until it exits this phase. |
The “Combinations” Report
If you want to see exactly what the final ad looked like (the “Winning Recipe”), check the combinations report:
- In the View details screen of your RSA or PMax asset group, click the Combinations tab.
- This shows you the top 10+ visual and text combinations that were served most often.
- Insight: If you see a specific “Long Headline” appearing in all your top combinations, that is your “hero” copy.
Performance Audit Checklist
- 90-Day View: Always look at a 90-day window to ensure your “Best” assets aren’t just a temporary trend.
- Pinning Check: If you “pin” a headline to Position 1, Google cannot test it in other positions. This often results in a “Good” rating instead of “Best” because the AI’s hands were tied.
- Asset Variety: Ensure you have at least 5 “Benefit” headlines and 5 “Call to Action” headlines. If all your copy sounds the same, the “Best” vs “Low” data will be less clear.

 Salesforce