Building a Looker Studio (formerly Data Studio) report for Google Ads allows you to turn raw data into a visual story that is easy to share with stakeholders.
In the current interface, the setup is highly automated, but the real value comes from how you structure your dashboard for decision-making.
Step 1: Connect Your Data Source
- Open Looker Studio: Go to lookerstudio.google.com and click the + Create button, then select Report.
- Select the Connector: In the “Add data to report” panel, search for the native Google Ads connector.
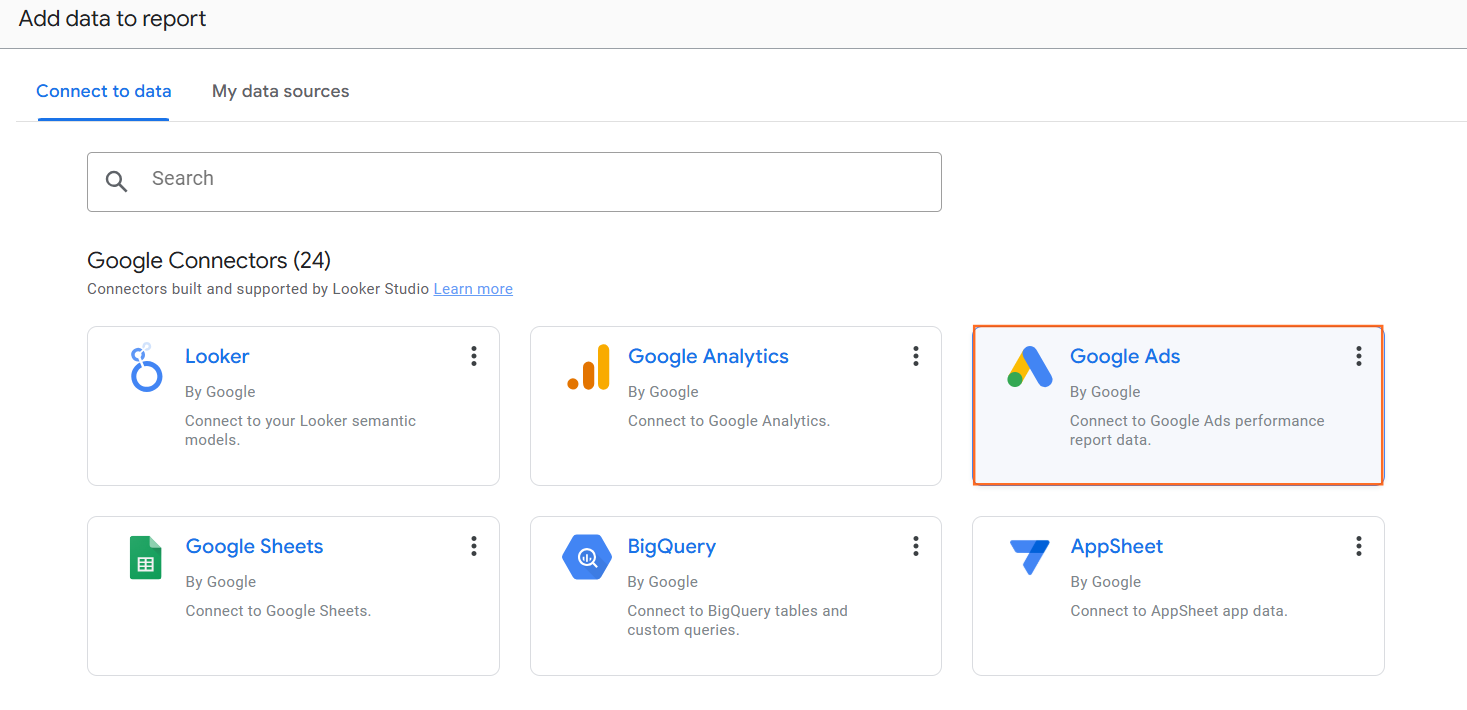
- Authorize & Select: Authorize the connection if prompted.
- Select your Account (or a Manager/MCC account if you want to report on multiple sub-accounts).
- Click Add and then Add to Report.
Step 2: Design Your Layout
A professional report should follow a “Top-Down” hierarchy:
- The Header: Includes your logo, the report title, and a Date Range Control (crucial for interactivity).
- The Scorecards: 3–5 high-level KPIs (Spend, Conversions, ROAS, CPA) at the very top.
- The Trends: Time-series charts showing performance over the last 30 days.
- The Tables: Granular breakdowns by Campaign, Search Term, or Device at the bottom.
Step 3: Key Visualizations to Include
Visualization Type | What to Track | Why? |
Scorecard | Total Cost / ROAS | Provides an instant “Health Check” of the account. |
Time Series | Conversions vs. Spend | Shows if your costs are rising faster than your results. |
Table | Campaign Performance | Identifies which specific campaigns are driving the most value. |
Geo Map | Conversions by Region | Visualizes where your customers are physically located. |
Pie Chart | Device Breakdown | Shows if you should be optimizing more for Mobile vs. Desktop. |
Advanced 2026 Features: Calculated Fields
Sometimes the native metrics aren’t enough. You can create your own “Calculated Fields” within the data source.
- Example (Profit Margin): (Conversion Value – Cost) / Conversion Value
- How to add: Go to Resource > Manage added data sources > Edit.Click + Add a field, enter your formula, and give it a name.
Best Practices for a Clean Report
- Use Themes: Under Theme and Layout, select a “Dark” or “Light” theme that matches your branding. Consistency makes the data feel more authoritative.
- Filters are Your Friend: Add a “Campaign Type” filter control at the top so you can toggle between Search, Video, and PMax data instantly.
- Conditional Formatting: In your tables, set a rule that turns a cell “Green” if the ROAS is above 4.0 and “Red” if it’s below 1.5. This helps you spot problems in seconds.
Troubleshooting: Why is my data different?
It is common to see slight discrepancies between Looker Studio and the Google Ads dashboard:
- Data Freshness: Looker Studio typically caches data for 15 minutes to 4 hours. If you just made a change in Ads, it won’t show up here immediately.
- Time Zones: Ensure the time zone in your Looker Studio report settings matches your Google Ads account settings.
- Removed Campaigns: By default, Looker Studio includes “Removed” campaigns. Add a filter to only show campaigns with the status “Enabled” or “Paused.”

 Salesforce