Exporting campaign data to a spreadsheet is a common task for in-depth analysis, reporting, and sharing with colleagues. The Google Ads interface allows you to download any table view (Campaigns, Keywords, Ads, etc.) quickly into various formats.
Step-by-Step Guide
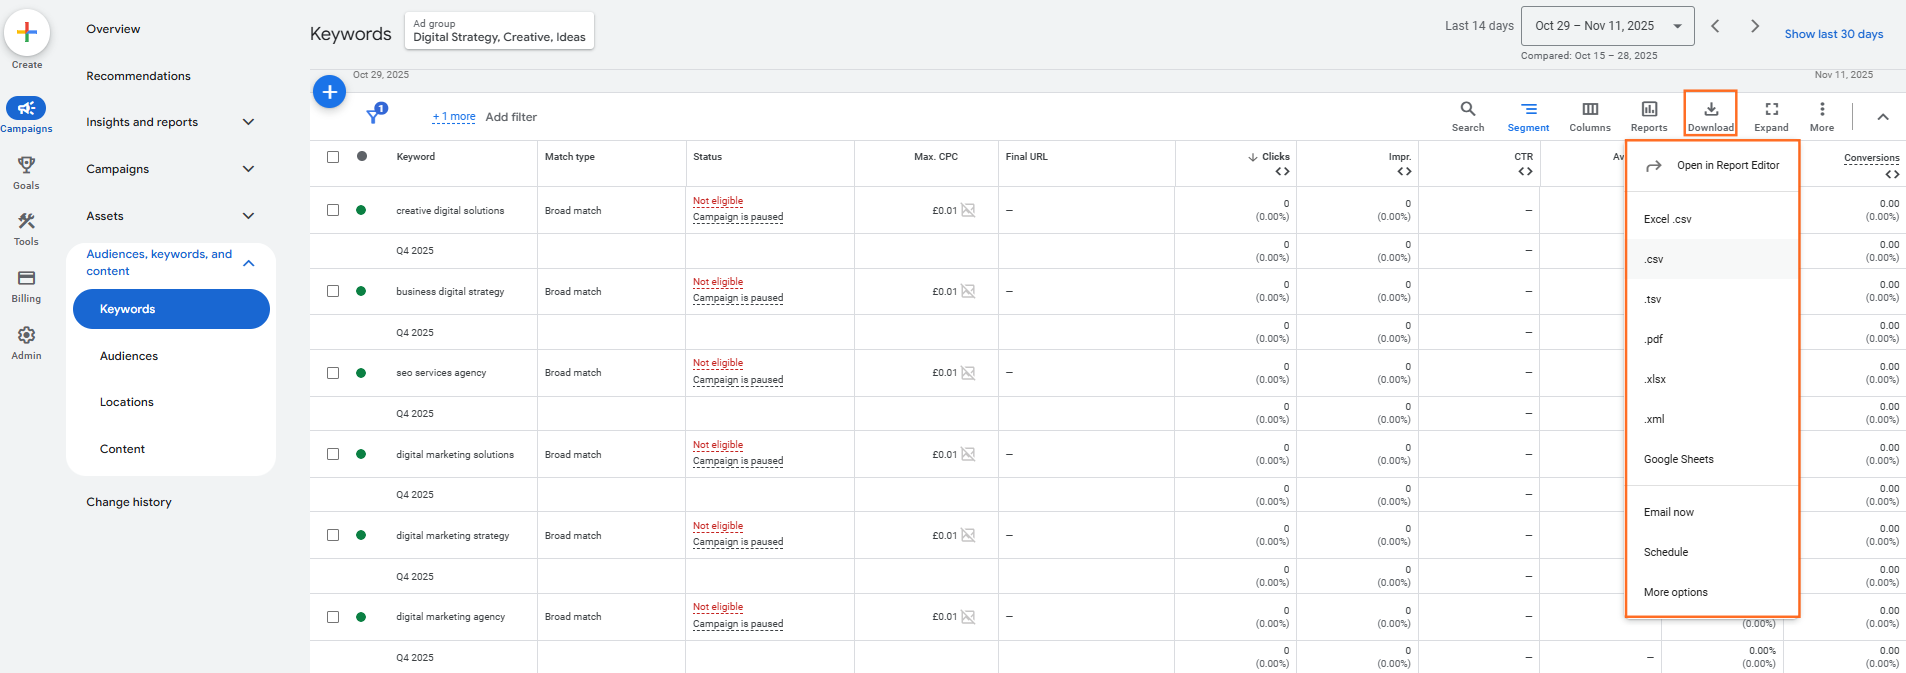
Step 1: Navigate to the Desired Report
- Sign in to your Google Ads account.
- Navigate to the specific table or report you want to export (e.g., click Campaigns, Ad groups, or Search keywords in the left-hand menu).
Step 2: Configure Your View (Crucial)
Before exporting, make sure the table contains exactly the data you need:
- Date Range: Set the correct date range in the top-right corner (e.g., “Last 30 days”).
- Filters: Apply any necessary filters (e.g., filter to show only campaigns with conversions, or only keywords with a Quality Score of 7 or higher).
- Columns: Use the Columns icon to add or remove metrics and attributes so that only the data you need is visible. The export will only include the columns currently visible in the table.
- Segment: If you want to break down your data (e.g., by Device, Day of the week, or Click type), apply the Segment option. Segmentation is critical as it creates extra rows in the report, allowing for deeper analysis in the spreadsheet.
Step 3: Initiate the Export
- Once your table is set up perfectly, look for the Download icon located directly above the statistics table.
- Click the Download icon.
Step 4: Choose the Format
A dropdown menu will appear asking for the file format. Choose the format that best suits your needs:
- .csv (Comma Separated Values): A universal, plain-text format compatible with all spreadsheet programs.
- Excel .xlsx: The native Microsoft Excel format.
- Google Sheets: This will automatically create a new, editable sheet in your Google Drive. (This is often the most convenient choice for internal team reporting).
- PDF: A static document format (not useful for data analysis).
- XML: A structured data format (primarily for technical users or software integration).
- .png: Image format
Step 5: Download the File
- Select your preferred format (e.g., Excel .xlsx).
- The file will begin generating and then download directly to your computer.
Our Advice
1. Export at the Lowest Level
- Advise: For the richest data, generally export data at the Keyword or Search terms level. This provides the most granular view of what users searched for, which you can then aggregate or pivot in your spreadsheet for analysis.
2. Saving Report Views
- Note: If you find yourself applying the same date range, filters, segments, and columns repeatedly, you can Save that specific setup as a custom report.
- Action: After configuring your columns, click the Columns icon and select Save column set. You can then reload this view instantly for future exports.

 Salesforce