Measuring the conversion rate from Lead to Opportunity is one of the most critical KPIs for assessing marketing and sales alignment. In Salesforce, the most effective way to track this is using the standard Lead with Converted Information report type.
Step 1: Create the Conversion Report
Salesforce provides a specific report type that “remembers” the link between a Lead and the Opportunity it became.
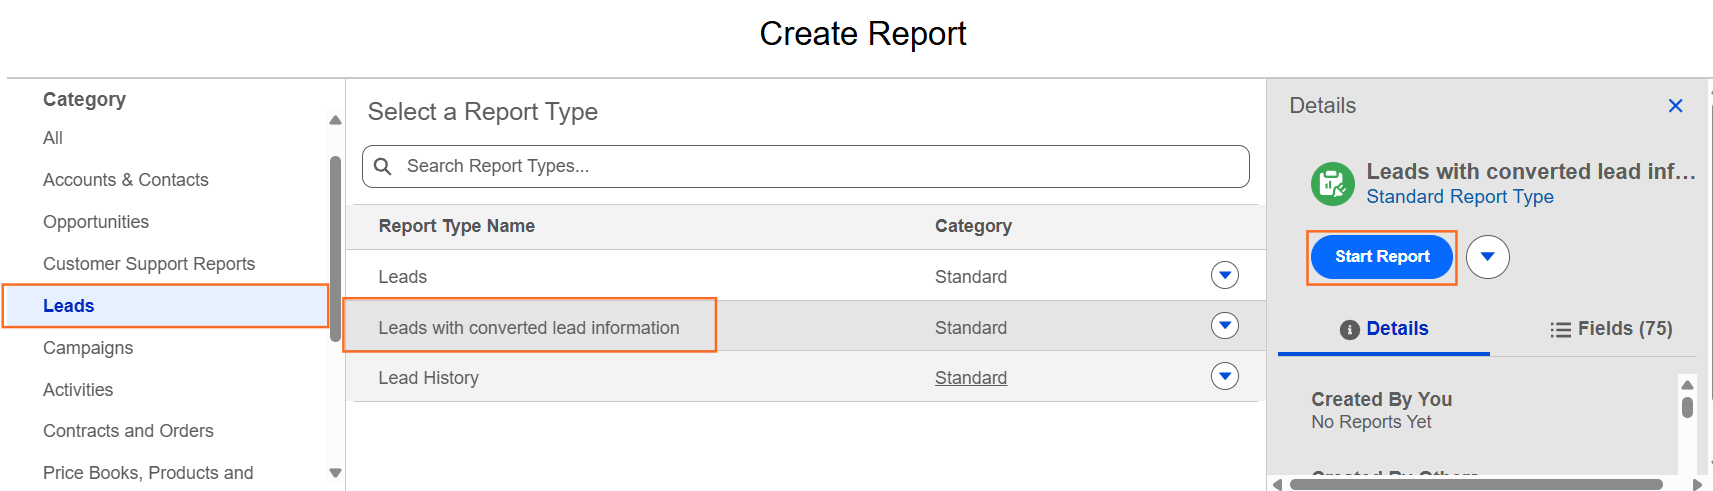
- Navigate to the Reports tab and click New Report.
- Search for and select the report type: Leads with converted lead information.
- Click Start Report.
Step 2: Configure the Filters
To get an accurate conversion rate, you need to look at all leads within a specific timeframe.
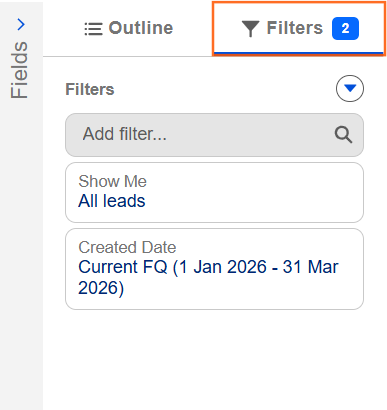
- Go to the Filters tab.
- Set Show Me to “All Leads.”
- Set Created Date to a specific period (e.g., “Current Fiscal Quarter”).
- Set Lead Status to “Any.”
Step 3: Group and Summarize
To calculate a percentage, you need to group the data so Salesforce can see the “Converted” vs. “Unconverted” totals.
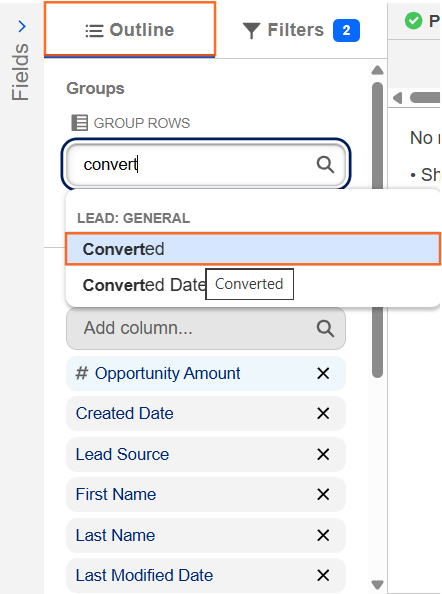
- Go to the Outline tab.
- In the Group Columns section, search for and select the field Converted.
- Note: This is a checkbox field. “True” means it became an Opportunity; “False” means it is still a Lead.
- (Optional) Add a second grouping for Lead Source or Owner if you want to see conversion rates by channel or team member.
Step 4: Create a Formula to Calculate %
To see a single “Conversion Rate” percentage, you can add a Summary Formula Column.
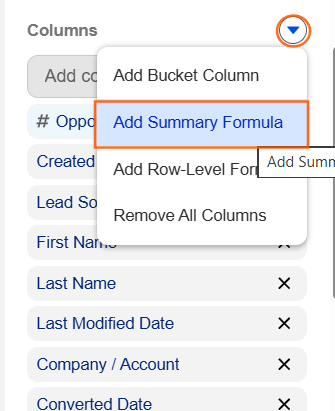
- In the Outline tab, click the arrow next to Columns and select Add Summary Formula.
- Column Name: Conversion Rate (%).
- Formula Output Type: Percent.
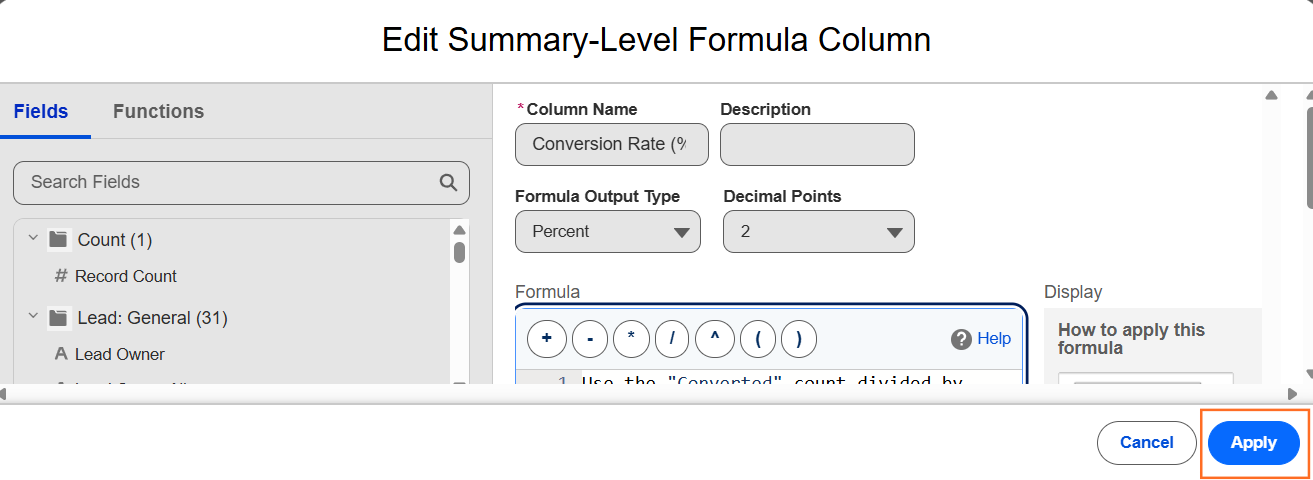
- Formula: Use the “Converted” count divided by the total count:
CONVERTED:SUM / ROW_COUNT - Click Apply.
Step 5: Visualize with a Gauge or Donut Chart
A percentage is best viewed as a visual “Progress” chart.

- Click Add Chart at the top of the report.
- Select the Gauge or Donut chart type.
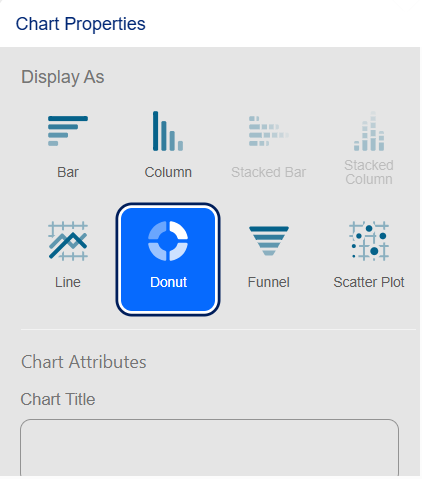
- In the chart settings, set the Measure to your new “Conversion Rate (%)” formula.
- If using a Gauge, set your “Red/Yellow/Green” breakpoints (e.g., 0-10% is Red, 10-20% is Yellow, 20%+ is Green).
Step 6: Technical Insights for Documentation
- The “Converted” Checkbox: Remind your team that this field is system-generated. It only flips to “True” when a user clicks the Convert button on a Lead record.
- Lead Quality: If your conversion rate is high but your “Closed Won” rate is low, it might suggest that leads are being converted too early before they are truly qualified.
- Tracking “Lost” Leads: Ensure you are also tracking leads that are “Closed – Not Converted” to understand why they didn’t make it to the Opportunity stage.

 Salesforce