Adding a report chart directly to an Opportunity, Account, or Contact page allows your team to see visual data (like a sales trend or a history of cases) without leaving the record they are working on.
Step 1: Prerequisite: Prepare the Report
Before you can add a chart to a page, you must have a report that meets two specific criteria:
- The Report must have a Chart: Open your report in the Report Builder, ensure it is grouped (Summary or Matrix), and click Add Chart.
- The Report must be Filtered: To ensure a user sees data only related to the record they are looking at, you often need to include a filter (e.g., “Account ID”).
Step 2: Open the Lightning App Builder
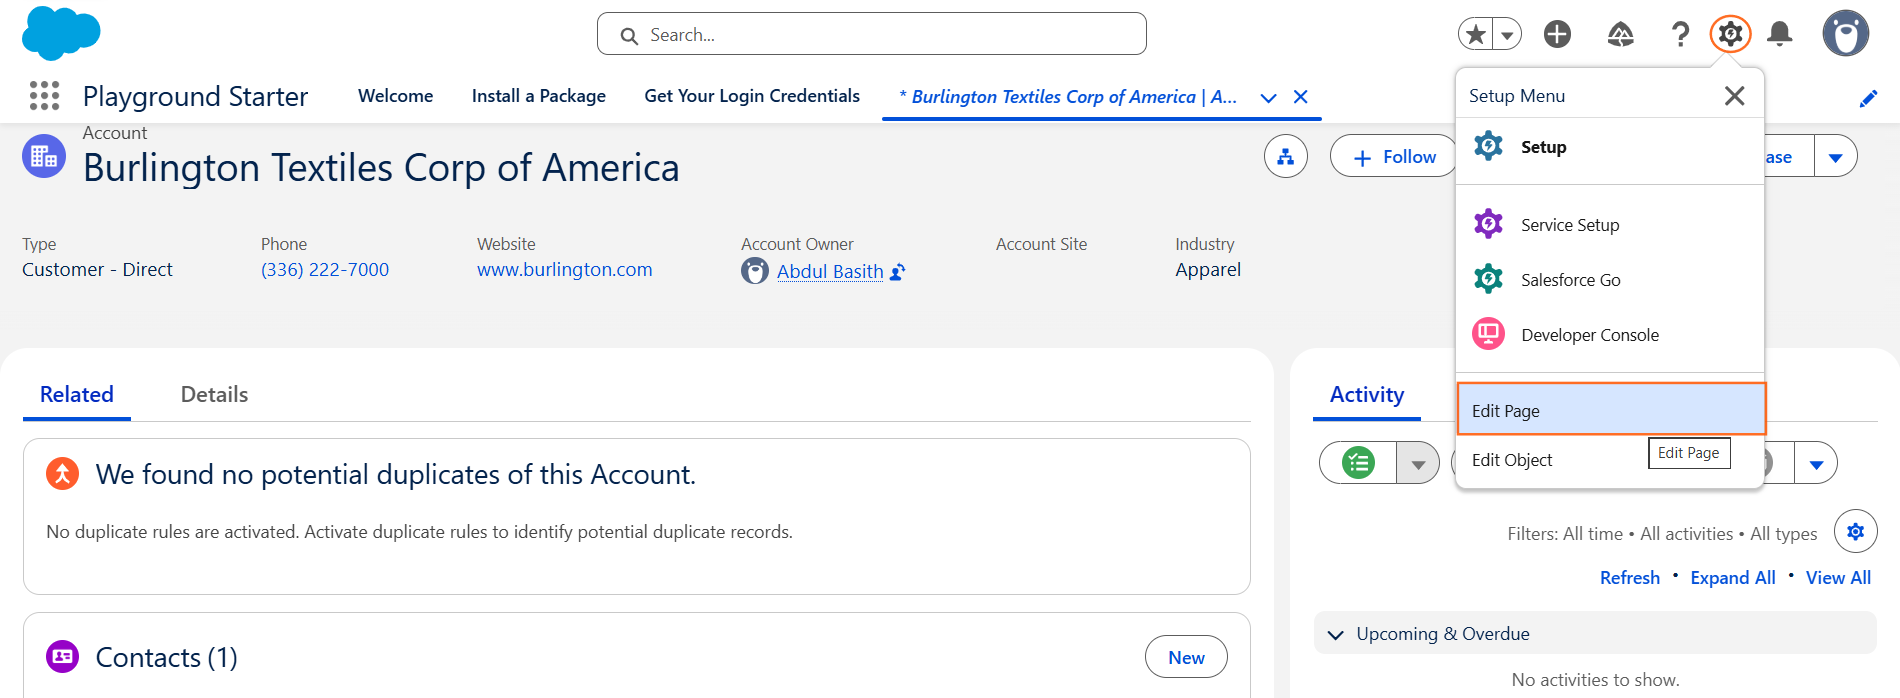
- Use App Launcher, Navigate to Account
- Choose a specific profile.
- Click the Gear Icon in the top-right corner.
- Select Edit Page.
Step 3: Add the Report Chart Component
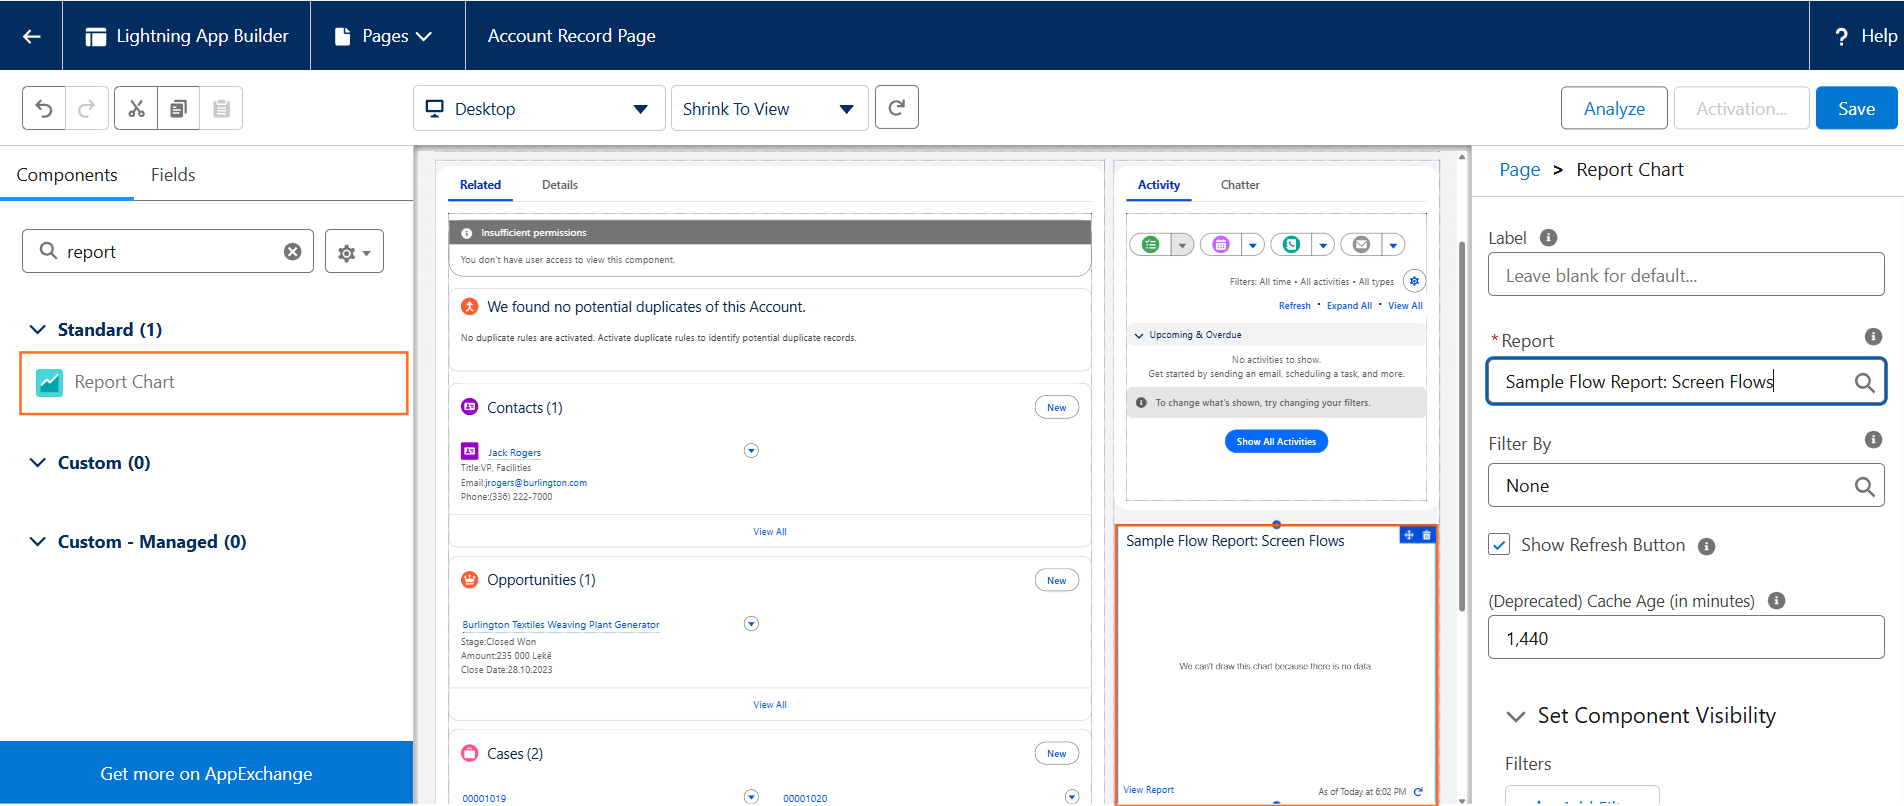
- On the left-hand side, in the Components search box, type Report Chart.
- Click and drag the Report Chart component onto the page canvas. Most people place it in a sidebar or a dedicated “Analytics” tab.
Step 4: Configure the Component Properties
Once the component is placed, click on it to open the properties pane on the right:
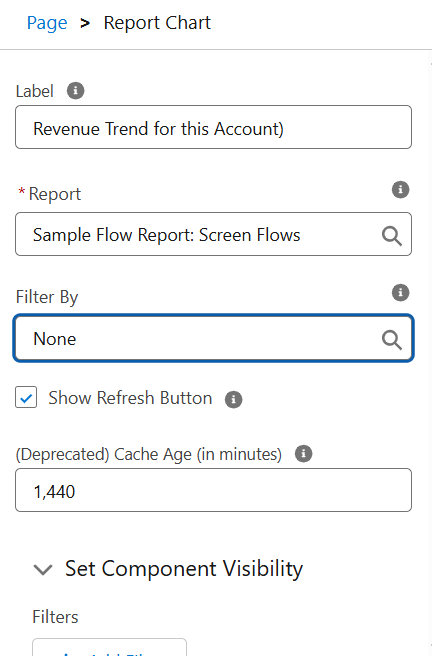
- Label: Give the chart a title (e.g., Revenue Trend for this Account).
- Report: Search for and select the report you created in Step 1.
- Filter By: This is the most important step. Check the box Filter by [Object] ID (e.g., Filter by Account ID).
- Why? This ensures that if you are looking at “Acme Corp,” the chart only shows data for Acme Corp, not the entire company.
- Show Refresh Button: Check this so users can get the latest data manually.
Step 5: Save and Activate
- Click Save.
- If you haven’t activated this page yet, click Activate and assign it as the Org Default (or by App/Profile as needed).
- Click the Back button to view your live record.
Step 6: Troubleshooting "No Data to Display"
If your chart appears empty on the record page, check these three things:
- Permissions: Does the user have access to the Folder where the report is stored?
- Filtering: Did you remember to check the Filter by ID box in the App Builder?
- Report Data: Does the specific record you are looking at actually have data that meets the report’s criteria? (e.g., an Account with no closed Opportunities won’t show an “Opportunity History” chart).

 Salesforce